XRP: 7-Year Pattern Forecasts ‘Conservative’ $38 Target

Exciting news for XRP fans! It seems the bulls are back in charge, and the reason? The Securities Exchange Commission (SEC) has dropped its case against Ripple.
For years, the shadow of the SEC lawsuit has hung over XRP, holding back its price. But now that this legal drama is finally over, analysts are buzzing, seeing it as a major green light for XRP’s growth.
And it’s not just the legal win boosting confidence. Long-term technical indicators are also painting a bullish picture, suggesting XRP could be gearing up for significant and lasting gains, possibly even hitting those sought-after double-digit prices.
Adding fuel to the fire, technical analyst Gert van Lagen has spotted a significant bullish signal in XRP’s seven-year pattern. In a recent post on X (March 19), he highlighted this pattern, pointing to a potential breakout target of $38!
Van Lagen’s analysis reveals that XRP has successfully bounced back from the neckline of a massive double-bottom/ascending triangle formation. Historically, these formations have been strong precursors to explosive price surges!
Interestingly, Lagen’s outlook highlights that XRP has traced a similar pattern before, between 2014 and 2017. That time, it sparked a parabolic breakout that not only hit its technical target but doubled it! Now, it appears history might be getting ready to repeat itself, but on an even grander scale.
After years of price consolidation, XRP has recently retested and confirmed the neckline as a solid support level. This is often seen as a powerful signal that the next big move upwards is just around the corner.
Based on a measured move projection, Gert van Lagen’s initial estimate for XRP’s breakout target is at least $38. However, keeping in mind the previous pattern repetition, he suggests the ultimate target could potentially soar much higher!
If history is any guide, the last time XRP emerged from a similar setup, it doubled its initial projected target. This hints that $38 might just be the starting point for a much larger rally!
Imagine this: if XRP does reach a record high of $38, its market capitalization would skyrocket to an estimated $2.2 trillion! That could potentially make it the most valuable digital asset, assuming Bitcoin (BTC) doesn’t make significant gains during the same period.
XRP social sentiment spikes
Now, while a $38 target certainly sounds ambitious, there’s a crucial step XRP needs to take first: reclaiming the $3 support zone. And to achieve that, the participation of retail investors will be key.
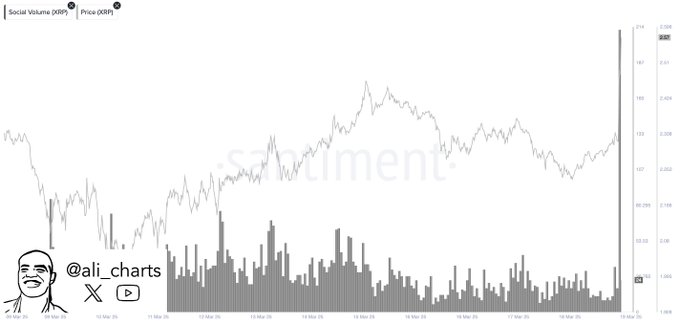
On that note, data shared by renowned crypto analyst Ali Martinez on March 19 highlights a very interesting trend: XRP sentiment on social media is exploding following its recent price surge. This increased buzz strongly suggests growing retail interest, often a telltale sign that FOMO (fear of missing out) is starting to kick in.

While a surge in social media engagement can definitely pump up short-term rallies and sometimes signal an overheated market, Martinez also points out that XRP’s latest surge might not be as robust as it initially appears.
In fact, data from crypto on-chain analysis platform Santiment reveals that no major ‘whale’ investors are driving this current price pump with significant buying. Instead, open interest has jumped by a massive $200 million, hinting that this rally might be fueled more by leveraged trading than by genuine organic demand.
While using leverage can certainly magnify potential gains, it also amps up the risk of sharp price drops if traders face a ‘squeeze’. Therefore, investors should keep a close eye on whether sustained buying pressure materializes to confirm if this price movement has genuine momentum or is just a temporary blip.
XRP price analysis
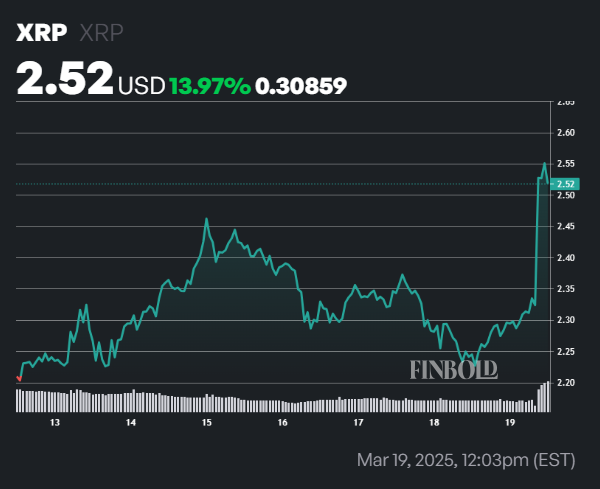
As of writing, XRP is trading at $2.52, marking an impressive 12% jump in just the last 24 hours! Looking at the weekly chart, the asset is even more impressive, showing a 14% climb.

Currently, the overall sentiment around XRP is still bullish, even with a Fear & Greed Index reading of 32 (indicating ‘Fear’). Technical indicators are giving mixed signals; the 50-day simple moving average (SMA) at $2.45 is just below the current price, suggesting short-term support. Meanwhile, the 200-day SMA, way down at $1.66, clearly highlights a strong long-term upward trend.
Featured image via Shutterstock


