Bitcoin: Stalled by Opposing Signals
Bitcoin (BTC) is starting April on uncertain ground. It finds itself wrestling between weakening bearish trends and growing anticipation for Wednesday’s big event: the “Liberation Day” tariff announcement. Looking at technical indicators like the DMI, Ichimoku Cloud, and EMA lines, we’re seeing a mixed bag of signals, though there are hints that buyers might be starting to step in.
For Bitcoin, the market feels like it could swing either way right now. We could see prices dip lower to test support levels, or we might witness a breakout rally, and it all hinges on how broader market events unfold. Keep an eye out, because with the JOLTS report coming out today and still waiting on clarity around those tariffs, Bitcoin’s next significant move could be just around the corner.
BTC DMI Shows Buyers Took Control, But Will It Last?
There’s a possible shift in momentum brewing, according to Bitcoin’s Directional Movement Index (DMI). The Average Directional Index (ADX), which tells us how strong a trend is (regardless of whether it’s up or down), has eased off to 28.59 from 40.38 just yesterday. What does this mean? Well, it suggests the recent downtrend might be losing some of its oomph.
Typically, if the ADX is above 25, it’s considered a sign of a strong trend. When it dips below 25, like it is now, it can point to a trend weakening or the market moving sideways. While 28.59 still indicates a moderately strong trend, that drop is a signal that momentum is fading.
Adding to this picture, the +DI (positive directional indicator) has jumped up to 23.75 from 9.35, while the -DI (negative directional indicator) has decreased to 17.88 from 34.58. This shift suggests that bullish pressure might be starting to build.
This potential crossover of the +DI and -DI lines could be an early signal of a trend reversal, especially if price action and trading volume back it up. However, it’s really important to remember that Bitcoin is still generally in a downtrend for now.
Market watchers are also keeping a close eye on today’s JOLTS report, a key piece of data that tells us about job openings in the US. If this report is stronger than expected, it could give the dollar a boost and put downward pressure on crypto prices. On the flip side, if the data is weaker, it might increase expectations for interest rate cuts, which could give Bitcoin and other riskier assets a lift.
So, with these directional indicators showing potential change and important economic data coming into play, Bitcoin’s next move could be heavily influenced by outside factors. Interestingly, just recently BlackRock CEO Larry Fink even mentioned the idea that Bitcoin could potentially take over the US dollar’s role as the world’s reserve currency.
Bitcoin Ichimoku Cloud Shows The Bearish Trend Is Still Here
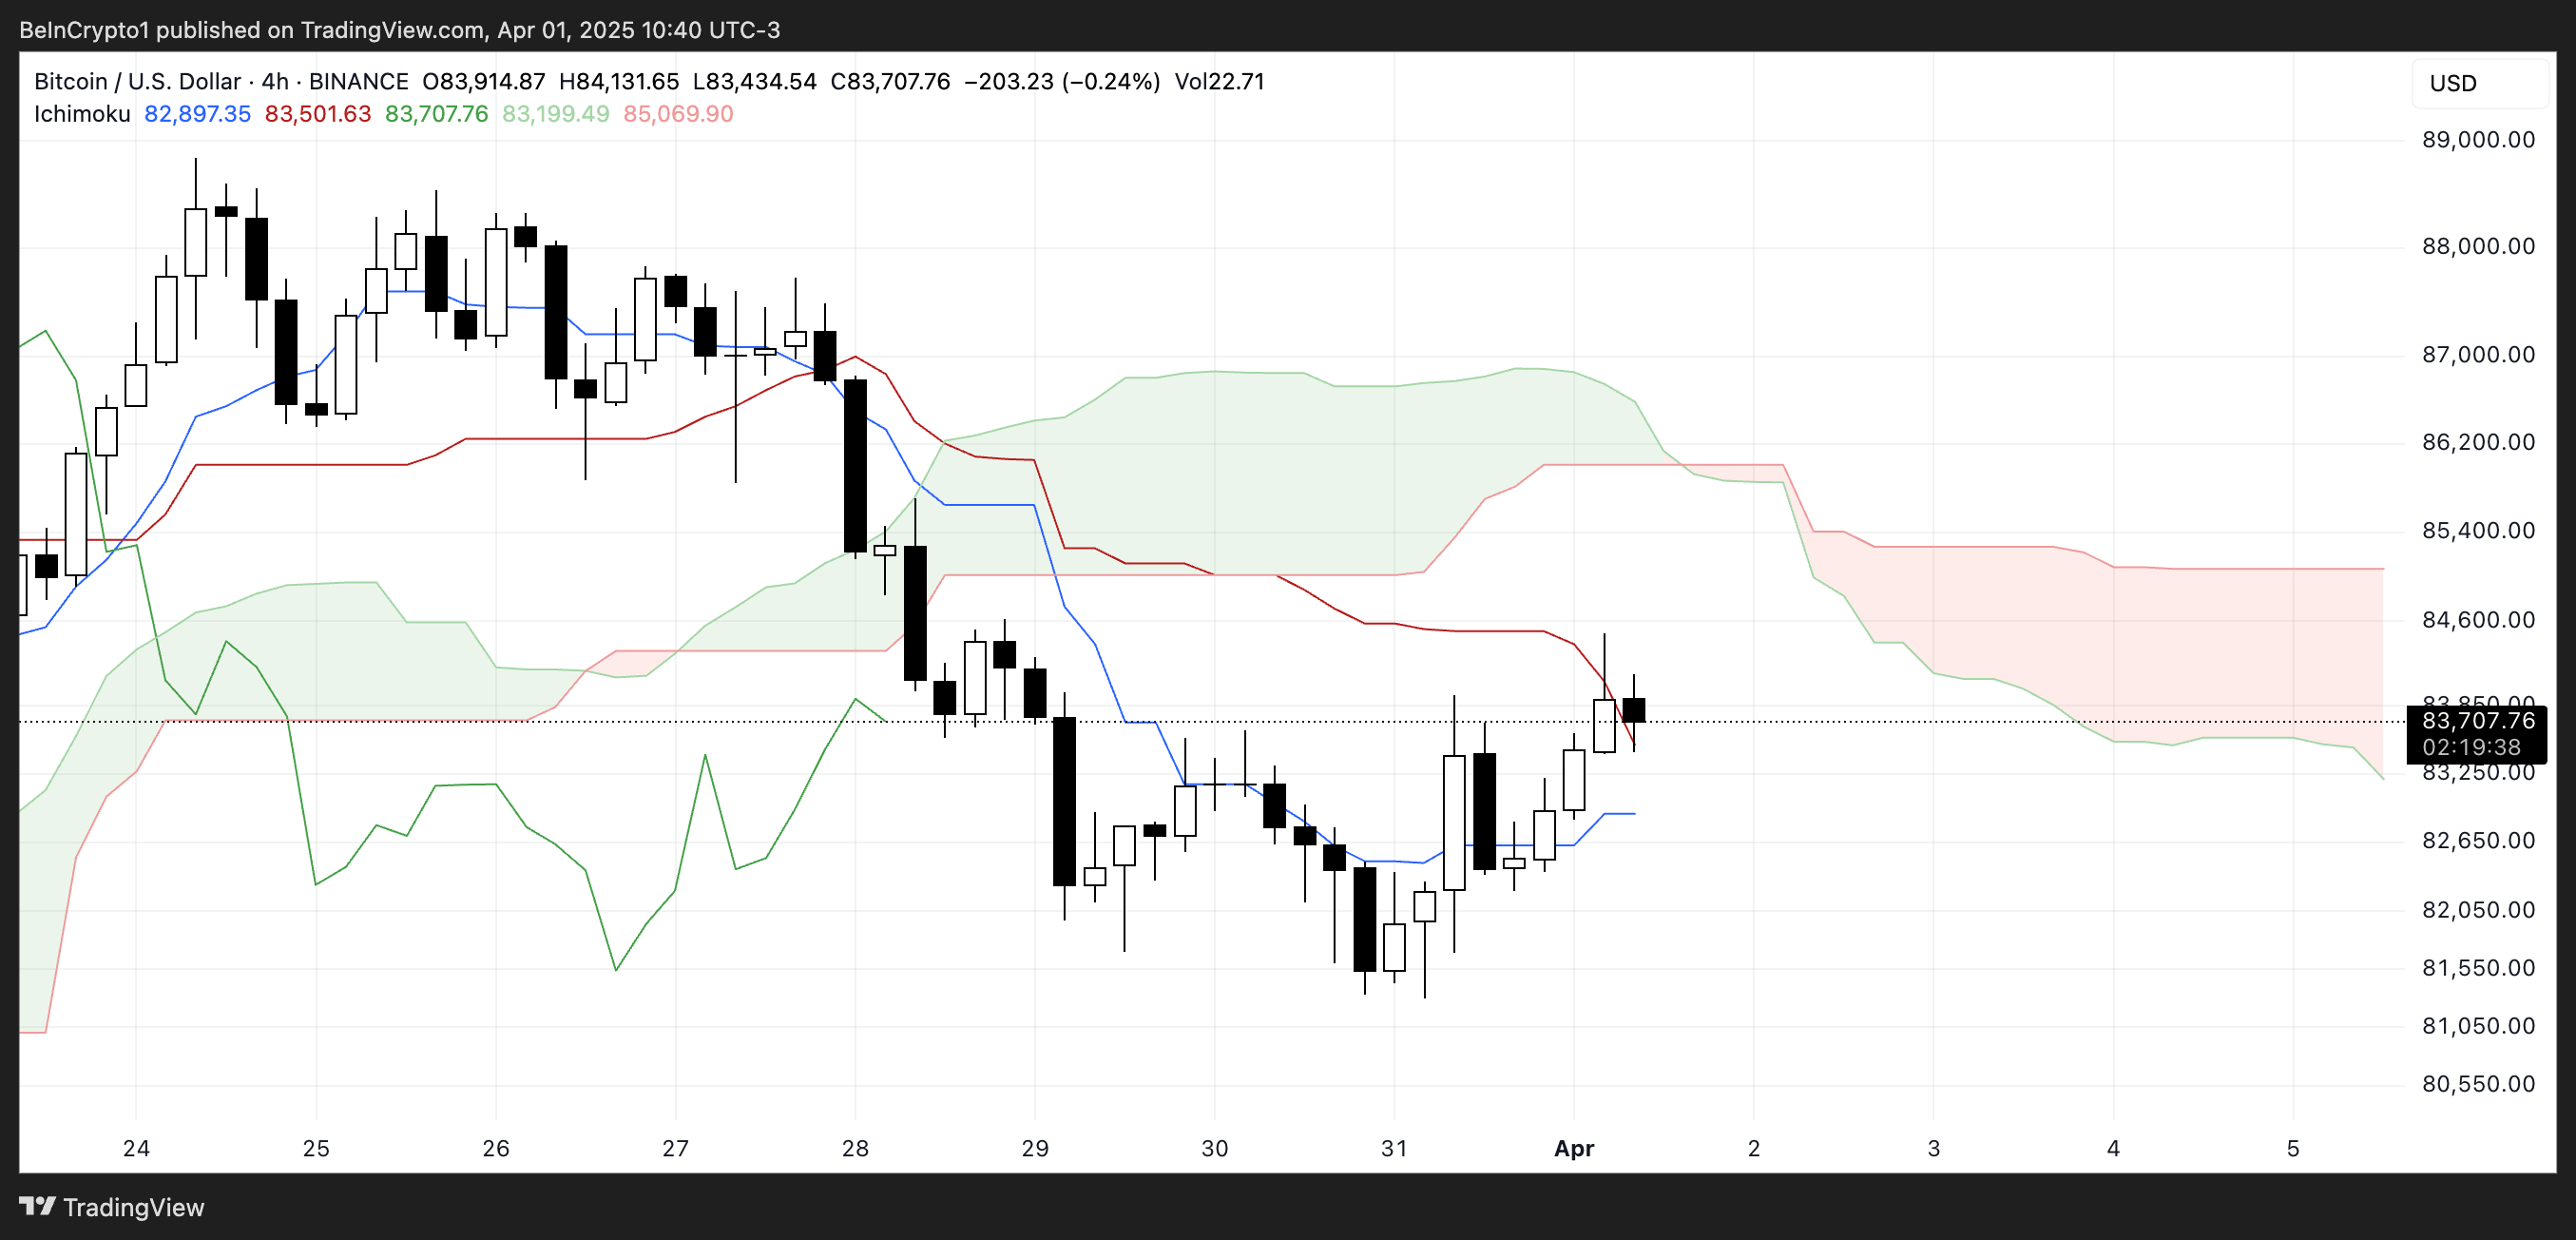
Turning to Bitcoin’s Ichimoku Cloud chart, it paints a picture of a market that’s still facing downward pressure overall, despite some recent hints of a short-term bounce-back. Currently, the price is testing the Kijun-sen (the red line), which is acting as a significant hurdle of resistance.
While the Tenkan-sen (the blue line) is starting to level out and curve upwards – often an early sign of shifting momentum – the fact that the price is still hanging below the Kumo (the cloud) suggests that the bigger trend is still bearish.
Looking ahead on the chart, the cloud is red and pointing downwards, indicating that we might expect continued pressure pushing prices lower in the near future.

However, we have seen the price briefly nudge into the lower edge of the cloud, which could be a sign of a potential challenge to this bearish structure.
For a stronger signal that the trend is truly reversing, Bitcoin would need to climb above the cloud and for us to see a bullish Kumo twist form. Until that happens, the Ichimoku Cloud setup is suggesting a cautious recovery at best for now.
Liberation Day Could Strongly Influence Bitcoin Price
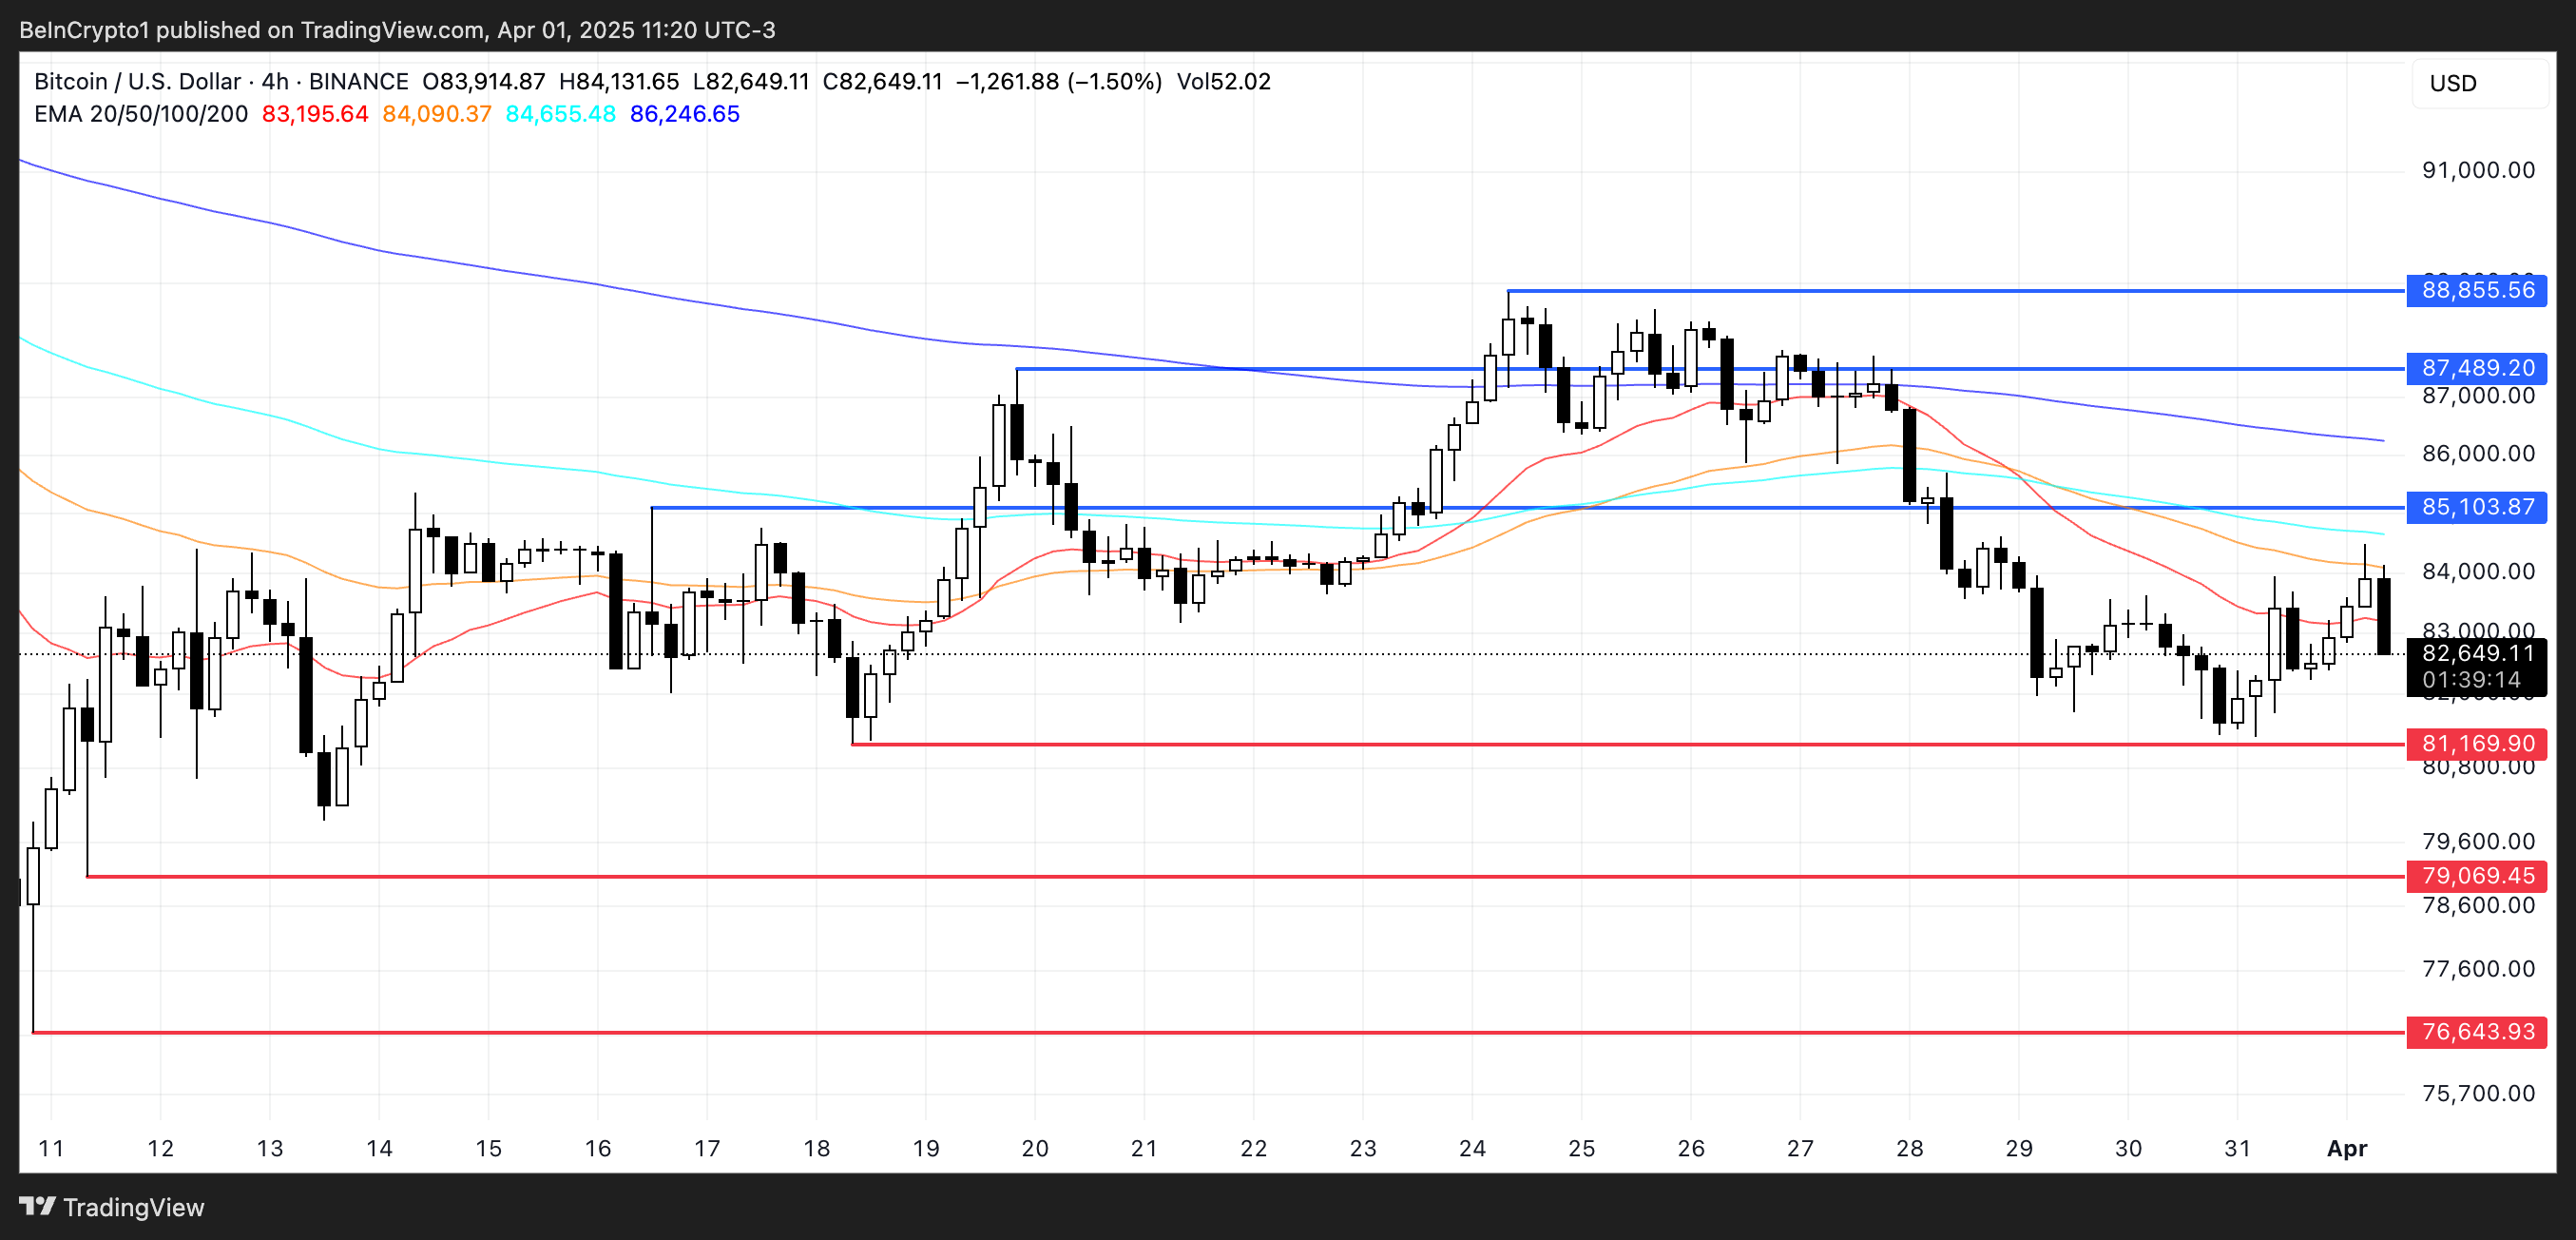
Looking at Bitcoin’s EMA lines, they are still giving off bearish signals. The shorter-term moving averages are still positioned below the longer-term ones, and that’s generally an indication that downward momentum is still in charge.
This setup suggests sellers are still in control of the trend, and unless things turn around, Bitcoin’s price could revisit key areas of support. If the current downtrend picks up speed, the first support level to watch is around $81,169. If that level doesn’t hold, we could see further drops towards $79,069 or even down to $76,643.
Crypto analyst Nic Puckrin, founder of The Coin Bureau, shared his thoughts with BeInCrypto, highlighting the market’s increased uncertainty as we approach the so-called “Liberation Day” tariffs. He pointed out that Bitcoin is currently in a position where it could make a big move either way – possibly dropping as low as $73,000 or surging upwards towards $88,000:
“As Liberation Day gets closer, the lack of clarity around just how big these tariffs will be is keeping Bitcoin and other risk assets in a state of limbo. (…) Until we get a clearer picture on these tariffs, this range-bound trading is likely to continue. However, if the news turns out to be less severe than feared, or if there are some concessions made, we could see a break out of this pattern. If that happens, $88,000 is the key level to watch in the short term, but for this to signal a sustained rally, we’d need to see a noticeable jump in trading volume.”

He also suggested that a negative surprise regarding tariffs could push BTC down to test levels around $73,000:
“On the flip side, if there’s a tariff shock, we could see BTC break down towards $79,000 in the near term, or potentially even further down to the next support level around $73,000 if extreme fear takes hold in the markets.“ – Nic told BeInCrypto.
Looking at the upside, if Bitcoin does manage to reverse the current trend and gain upward momentum, the first target to aim for would be resistance at $85,103. Breaking through that level could pave the way for further climbs towards higher levels at $87,489 and then $88,855.
Disclaimer
In line with the Trust Project guidelines, this price analysis article is for informational purposes only and should not be considered financial or investment advice. BeInCrypto is committed to accurate, unbiased reporting, but market conditions are subject to change without notice. Always conduct your own research and consult with a professional before making any financial decisions. Please note that our Terms and Conditions, Privacy Policy, and Disclaimers have been updated.

