Forecast: Bitcoin Q3 2025 Indicator Outlook

Bitcoin’s journey in 2025 has been interesting, to say the least. It hasn’t quite been the explosive bull market that many were anticipating. After briefly soaring past $100,000, the price of Bitcoin actually pulled back quite a bit, dipping down to around $75,000. This has naturally led to a lot of discussion – and perhaps some anxiety – among investors and analysts, as everyone tries to figure out where we are in the bigger Bitcoin picture. So, let’s cut through the chatter and get to the heart of the matter. We’re going to use on-chain indicators and look at the broader economic landscape to get a clearer sense of things. Are we still in a bull market for Bitcoin, or should we brace ourselves for a more significant correction as we move into Q3 of 2025? To help us find answers, we’ll be paying close attention to key metrics like the MVRV Z-Score, Value Days Destroyed (VDD), and Bitcoin capital flows – these can offer valuable clues about what might be coming next.
Is Bitcoin’s 2025 Pullback Healthy, or Is the Bull Cycle Over?
When we’re trying to understand where the 2025 Bitcoin cycle is headed, a great place to start is with the MVRV Z-Score. This is a well-regarded on-chain indicator that essentially compares Bitcoin’s market value to its realized value. Think of it as getting a sense of whether the market is overvalued or undervalued. After reaching a high of 3.36 when Bitcoin hit that $100,000 peak, the MVRV Z-Score then fell to 1.43. This drop coincided with Bitcoin’s price decline from $100,000 to $75,000 – that 30% correction might have felt pretty dramatic. However, the good news is that recent data shows the MVRV Z-Score is now bouncing back up from that 2025 low of 1.43.
Looking back at Bitcoin’s history, MVRV Z-Score levels around 1.43 haven’t actually signaled the end of bull markets. Instead, they’ve often marked temporary lows – “local bottoms” – in previous bull runs, like in 2017 and 2021. These past pullbacks were often followed by renewed upward momentum. This historical pattern suggests that the recent correction might just be part of the usual, healthy back-and-forth we see in a bull cycle. While it’s understandable that investor confidence might be a bit shaky right now, this kind of movement really does fit with how Bitcoin market cycles have behaved in the past.
How “Smart Money” is Influencing the 2025 Bitcoin Bull Market
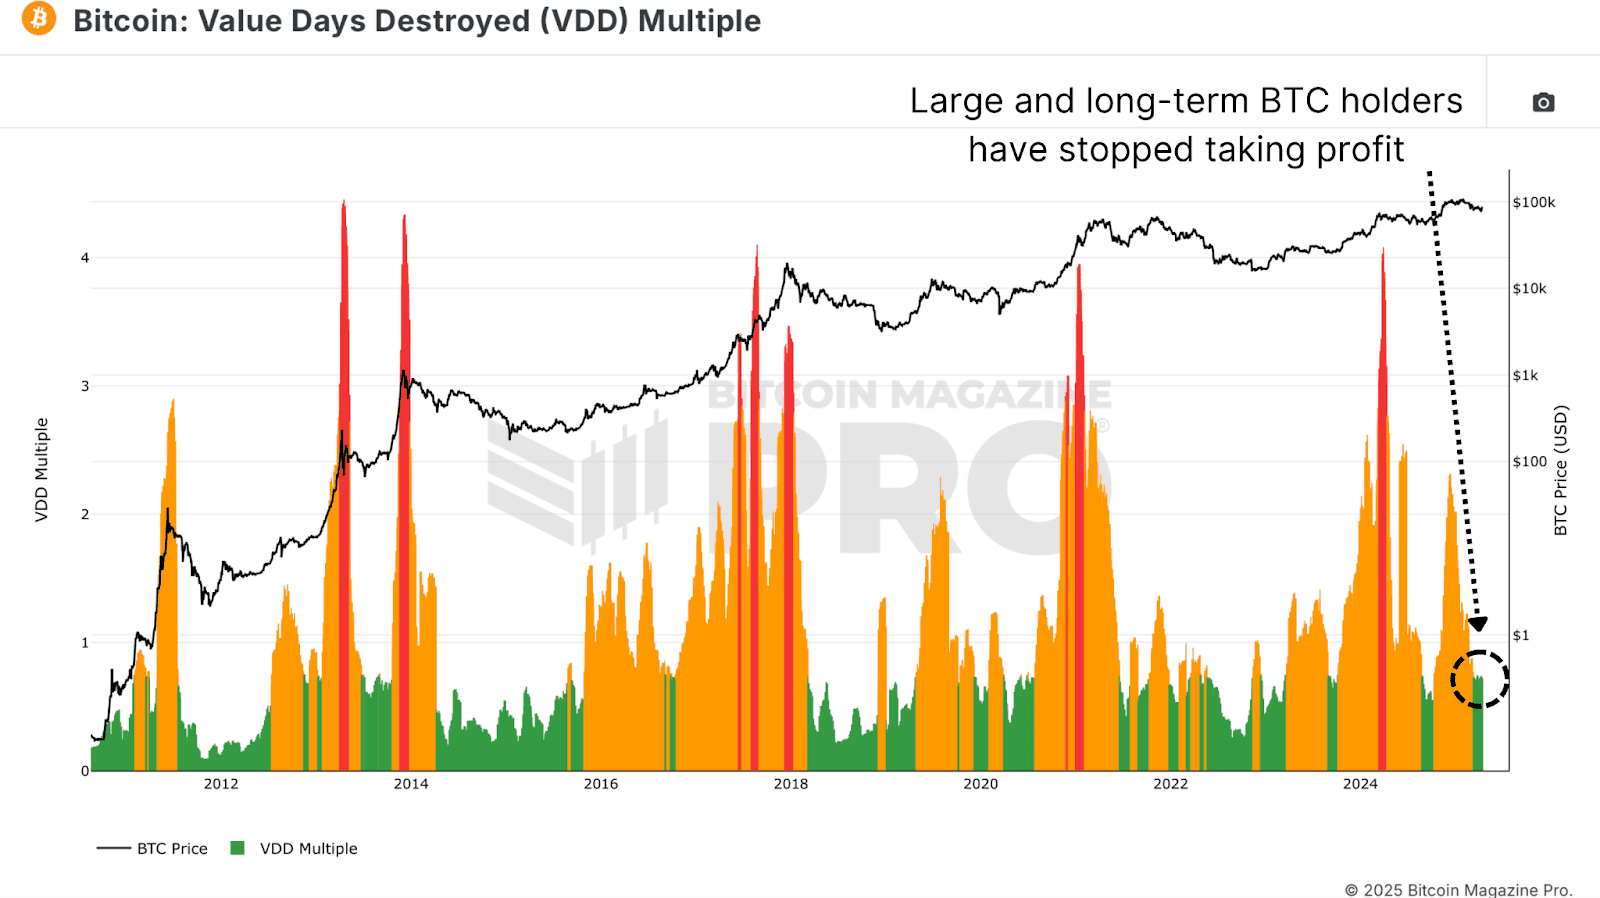
Let’s turn our attention to another key on-chain indicator: the Value Days Destroyed (VDD) Multiple. This indicator gives us insights into the pace of BTC transactions, but with an interesting twist – it gives more weight to coins that haven’t moved in a long time. When we see spikes in VDD, it often suggests that experienced, long-term holders are taking profits. Conversely, low VDD levels can indicate that Bitcoin is being accumulated, especially by those “smart money” players. Currently, the VDD Multiple is in what’s considered the “green zone.” Interestingly, we’ve seen similar levels during late bear markets or when bull markets are just starting to recover.

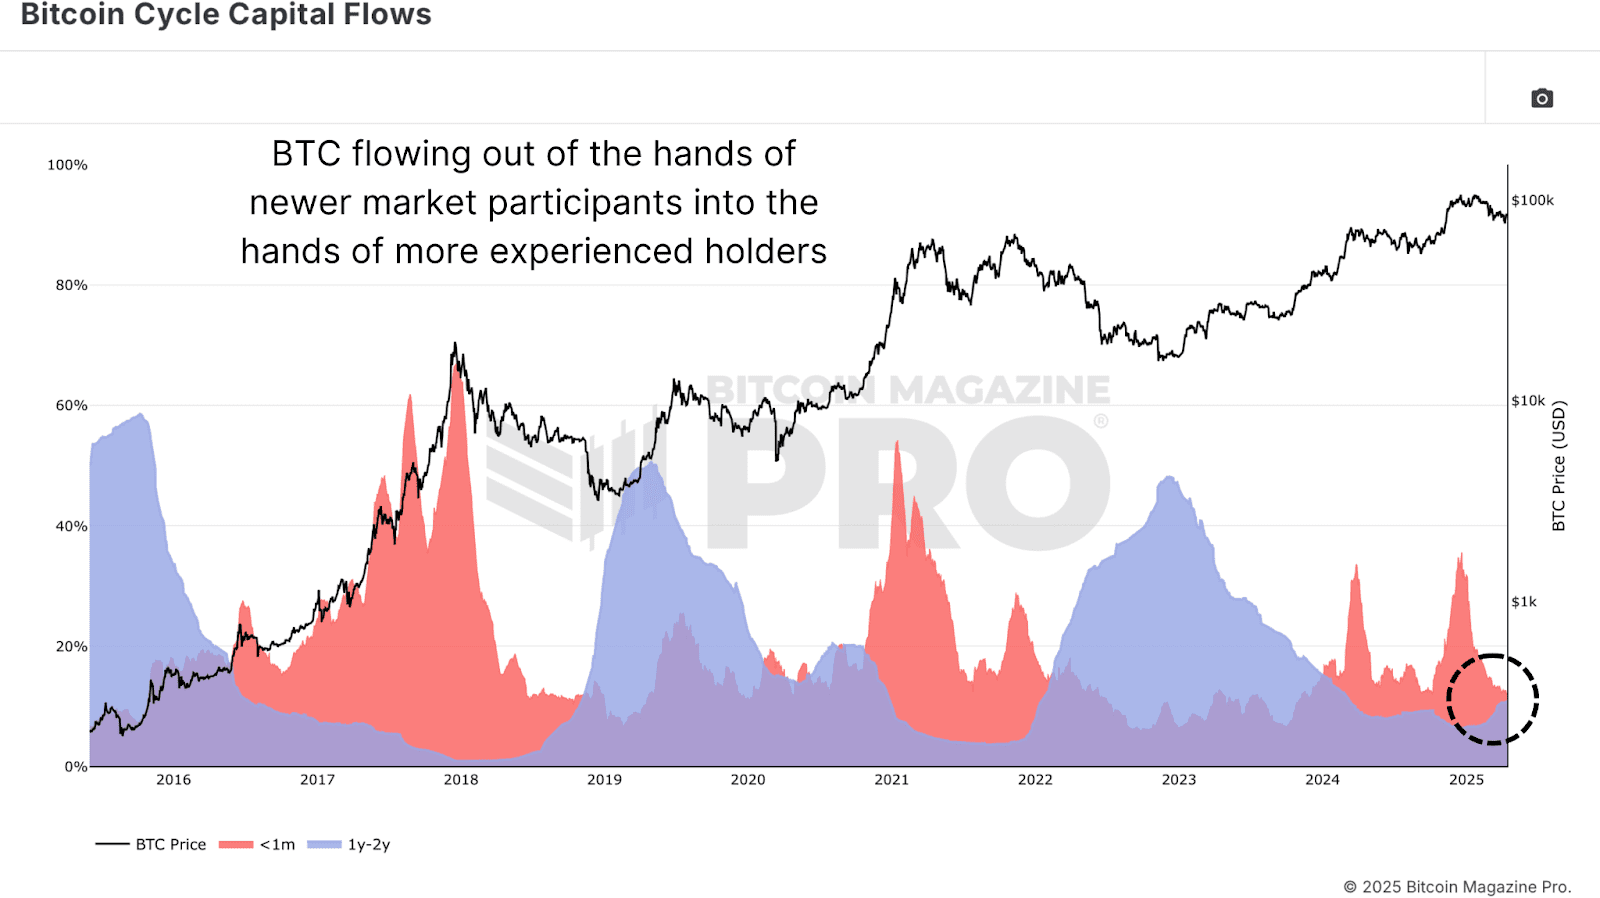
Following Bitcoin’s price drop from $100,000, the current low VDD levels seem to suggest that the phase of profit-taking is winding down. Instead, it looks like long-term holders are using this opportunity to accumulate more Bitcoin, betting on prices going higher later in 2025. The Bitcoin Cycle Capital Flows chart gives us even more detail on this trend. It breaks down realized capital based on how old the coins being moved are. Around the $106,000 peak, we saw a surge in activity from newer market participants – those holding coins for less than a month. This is often a sign of FOMO, or “fear of missing out,” driven buying. However, since the Bitcoin pullback, the activity from this newer group has calmed down and is back to levels we typically see in the early-to-mid stages of a bull market.
On the other hand, the cohort of holders in the 1–2 year range – often considered more experienced and macro-aware Bitcoin investors – is actually increasing their activity and accumulating Bitcoin at these lower prices. This pattern is quite similar to what we saw during accumulation phases in 2020 and 2021, where long-term holders bought during dips, ultimately setting the stage for significant bull market rallies.

Where Exactly Are We in the 2025 Bitcoin Market Cycle?
If we take a step back and look at the bigger picture, we can broadly divide the Bitcoin market cycle into three main stages:
- Bear phase: Characterized by significant Bitcoin price drops, often in the range of 70–90%.
- Recovery phase: The period where Bitcoin starts to climb back up and eventually reclaims its previous all-time highs.
- Bull/exponential phase: This is where we see explosive, almost vertical, price increases in Bitcoin.
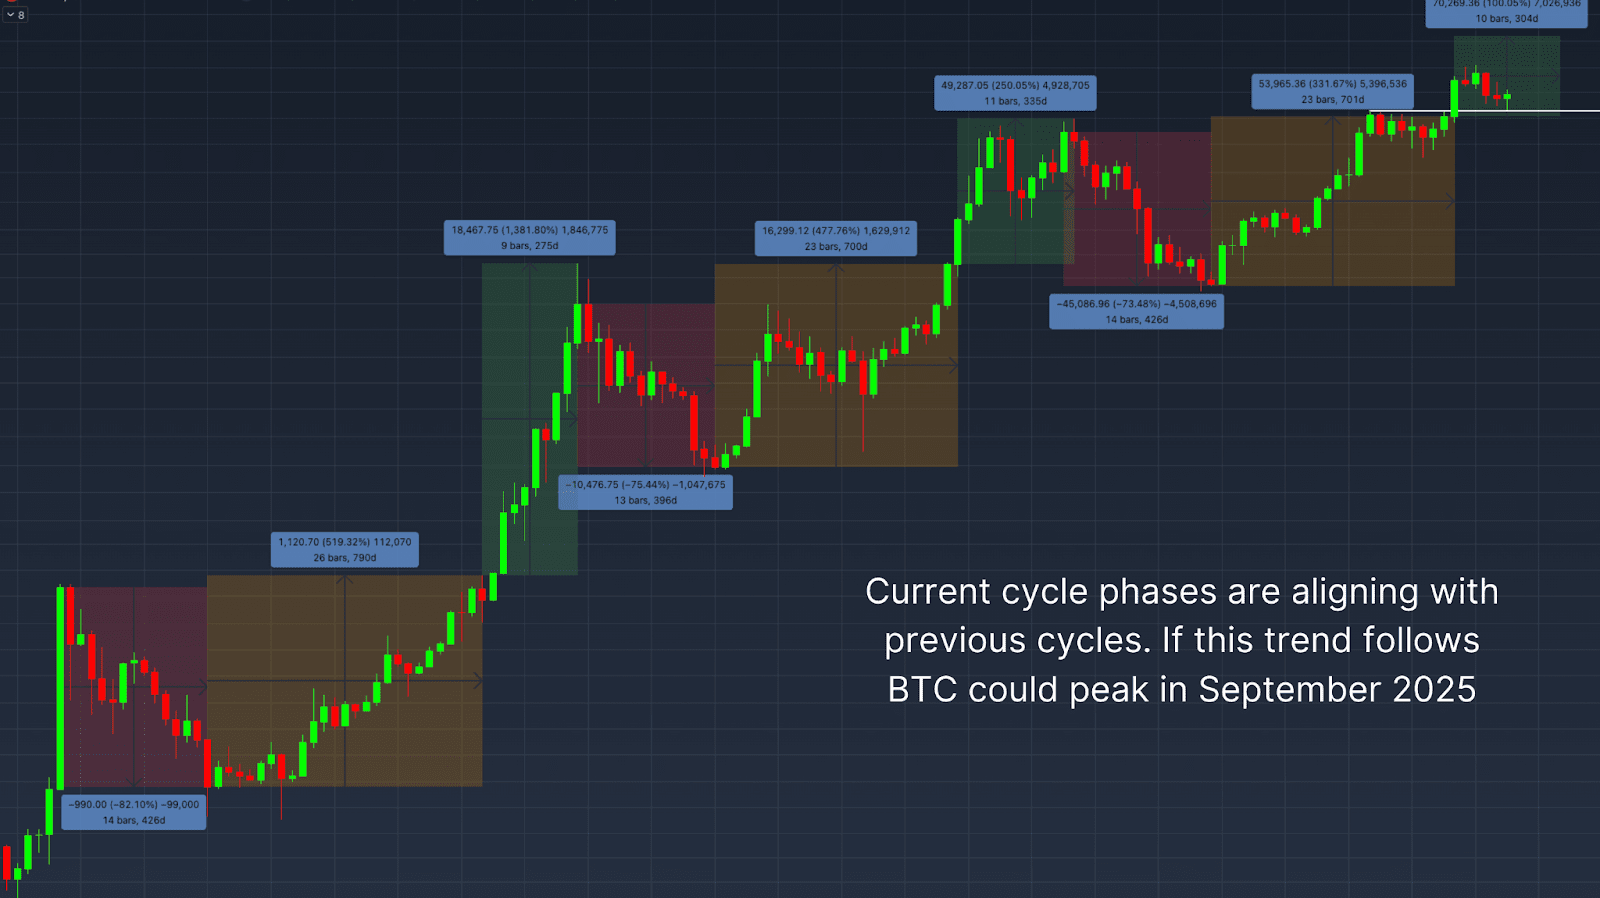
Historically, those tough bear markets (think 2015, 2018) have lasted around 13–14 months. The most recent Bitcoin bear market was no different, also lasting about 14 months. Recovery phases have typically been longer, spanning roughly 23–26 months, and the current 2025 Bitcoin cycle timeline does fit within this historical range. However, there’s a notable difference this time around. Unlike past bull markets, when Bitcoin broke above its previous highs, it wasn’t followed by an immediate, rapid surge. Instead, we’ve seen this pullback.

This recent Bitcoin dip might actually be a sign of a “higher low” forming, which could set the stage for the really explosive part of the 2025 bull market. If we look at past cycles, those exponential phases have typically lasted for about 9–11 months. If history repeats itself, and the bull cycle does indeed resume its upward trend, then we could see the Bitcoin price peak sometime around September 2025.
Macroeconomic Risks That Could Impact Bitcoin’s Price in Q3 2025
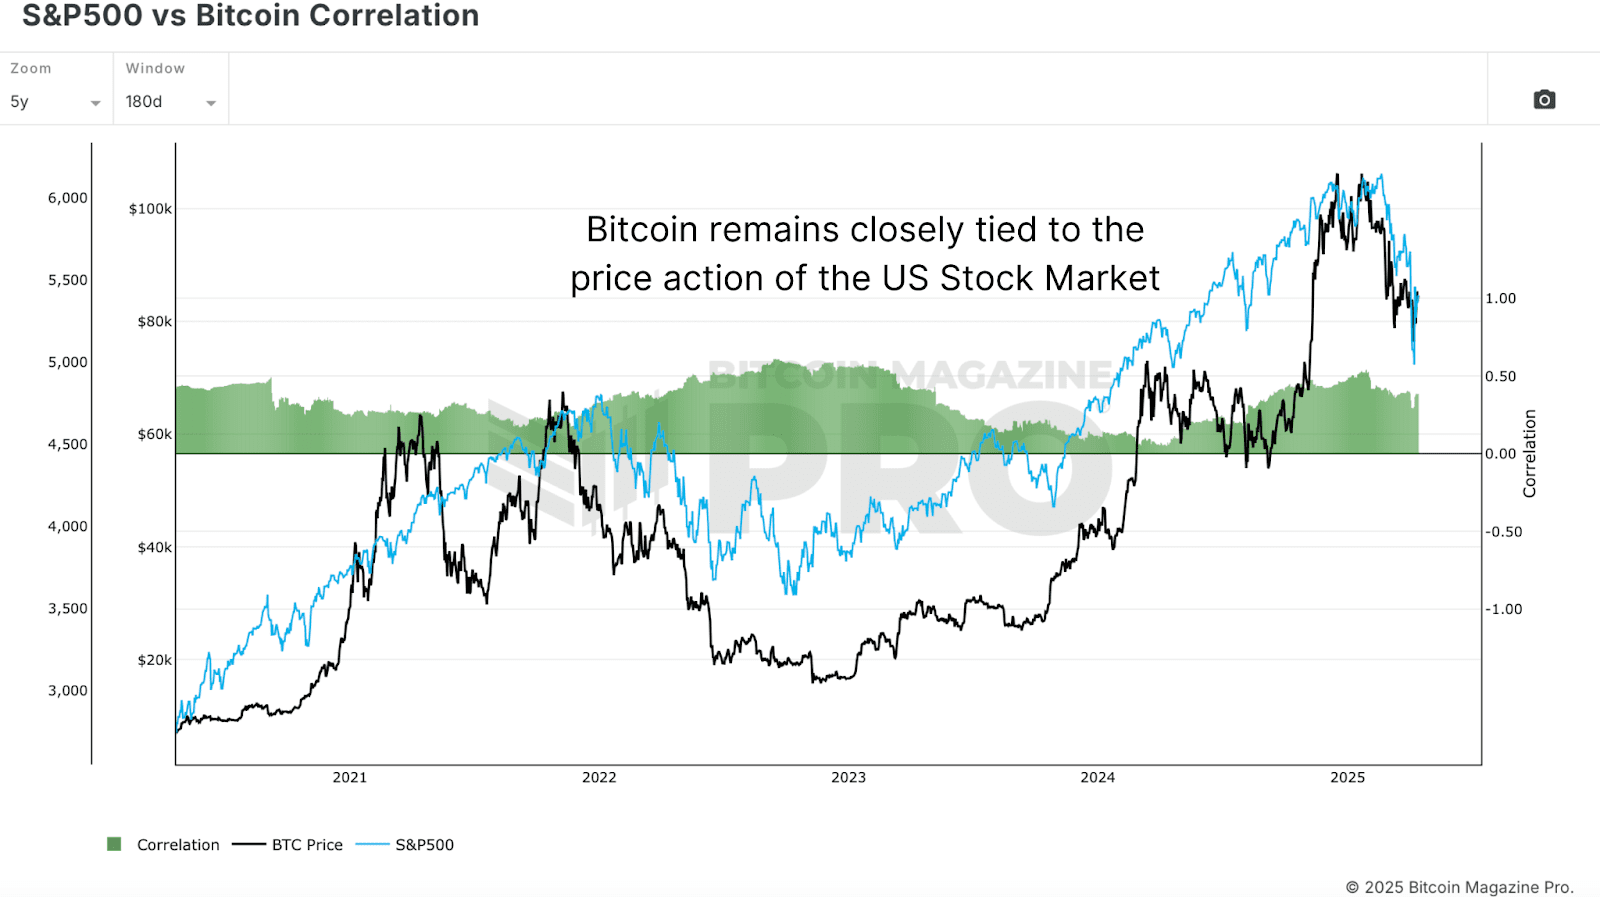
Even though those on-chain indicators are looking quite bullish, we can’t ignore the potential risks coming from the broader economic picture. The S&P 500 vs. Bitcoin Correlation chart reminds us that Bitcoin is still closely tied to the performance of U.S. stock markets. And right now, there are growing concerns about a potential global recession. If traditional markets show weakness, this could put a ceiling on how high Bitcoin can rally in the near term.

Keeping an eye on these macroeconomic factors is really important. Even with positive on-chain data, a downturn in the stock market could trigger a more significant Bitcoin correction in Q3 2025.
Conclusion: What to Expect for Bitcoin in Q3 2025
Overall, when we look at the key on-chain indicators – the MVRV Z-Score, Value Days Destroyed, and Bitcoin Cycle Capital Flows – they seem to paint a picture of a healthy market cycle. We’re seeing behavior that’s consistent with past cycles and signs that long-term holders are still accumulating Bitcoin in 2025. While this bull cycle might be progressing more slowly and unevenly compared to previous ones, the underlying structure still looks familiar. So, if the broader economic conditions can stabilize, Bitcoin certainly looks set up for another move upwards, potentially reaching a peak sometime in Q3 or Q4 of 2025.
However, it’s crucial to remember those macroeconomic risks we talked about, particularly the volatility in the stock market and the looming threat of recession. These are still major factors to watch closely. If you want to dive even deeper into this analysis, you can check out this YouTube video: Where We Are In This Bitcoin Cycle.
For even more in-depth research, technical indicators, real-time market updates, and to connect with a community of fellow analysts, be sure to visit BitcoinMagazinePro.com.

Disclaimer: Please remember that this article is for informational purposes only and shouldn’t be taken as financial advice. Always do your own thorough research before making any decisions about investing.


