Active Addresses Plunge: Ethereum Price Risks $1K Crash

Ethereum (ETH) price is taking a nosedive! It’s been a rough patch for ETH, as its price continues to tumble, now dipping below the $1,800 mark. Having plummeted almost 60% from its peak in November, Ethereum’s underlying health metrics are flashing warning signs. We’re seeing worrying trends like fewer active users, money flowing out of ETFs, and a significant drop in network fees – all hinting at a potential slide down to $1,000.
Active Addresses, Fees Plunge, and ETF Outflows: Is an Ethereum Price Plunge Imminent?
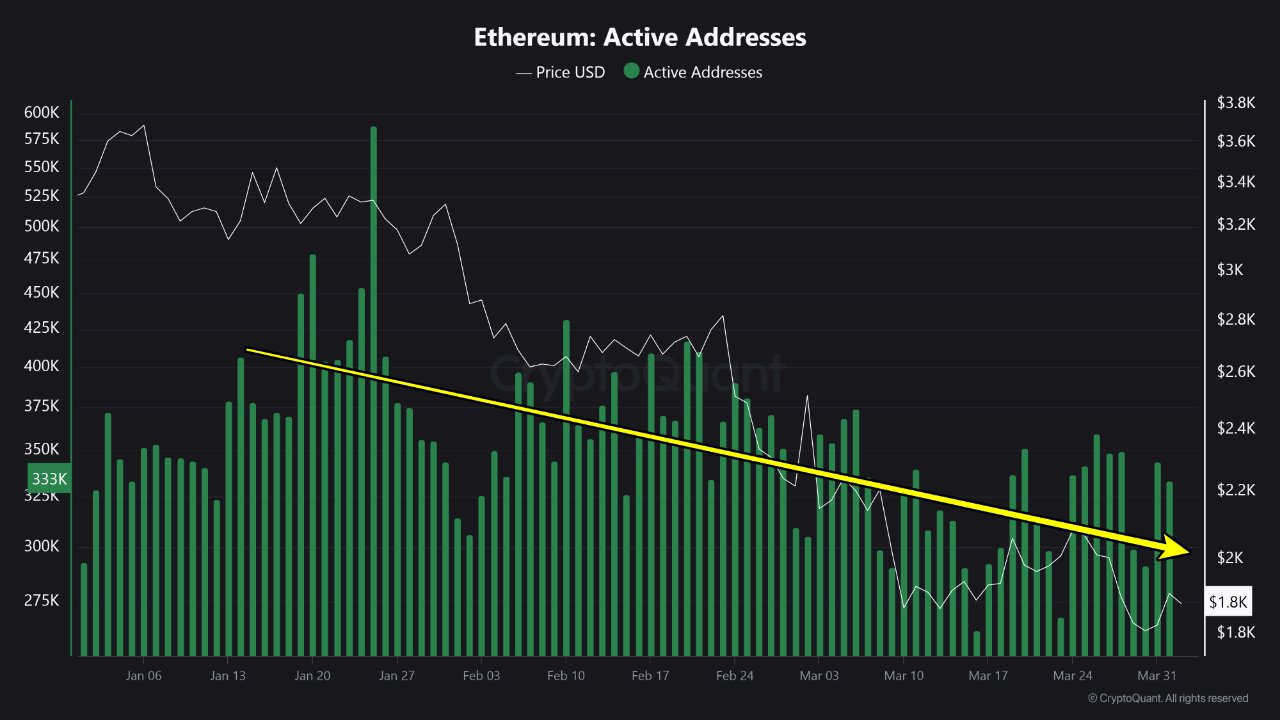
Could Ethereum’s price really crash to $1,000 soon? That’s the unsettling question many are asking as on-chain data paints a concerning picture. A key indicator is the dwindling number of active addresses on the Ethereum network. This decline suggests that some holders might be losing faith and selling off. Just to put it in perspective, back in January, ETH boasted over 575,000 active addresses. Now, that number has shrunk to a mere 333,000 – a significant drop that can’t be ignored.

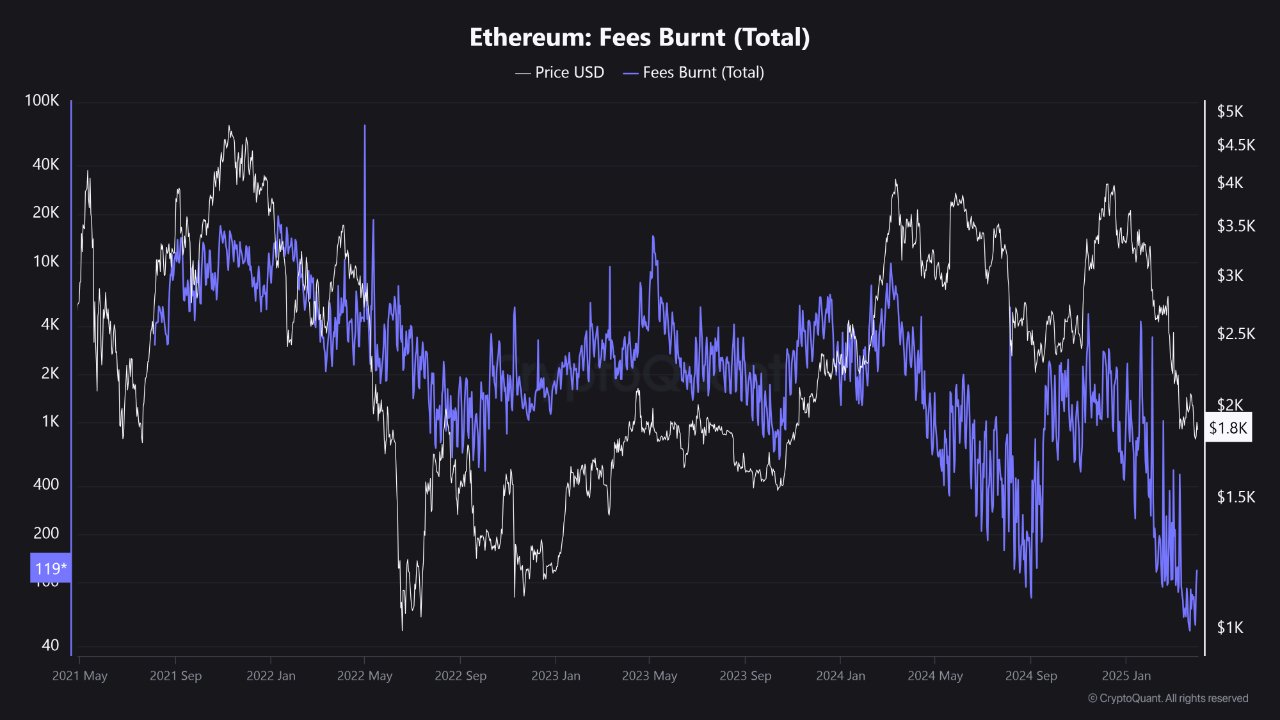
And it’s not just user activity that’s declining. The rate at which ETH is being “burned” – removed from circulation – is also slowing down, mirroring the slump in network fees. According to data from TokenTerminal, the Ethereum network has generated a mere $222 million in fees recently. This is a significant step down from its former glory, especially when you consider that other platforms like Uniswap, Solana, Jito, Circle, Tron, and even Tether are now out-earning Ethereum in fees. Just last year, Ethereum was the undisputed king of network fees, but those days seem to be fading.


Adding fuel to the fire, we’re seeing massive outflows from Ethereum ETFs. A staggering $403 million flowed out in March alone, pushing the total net outflow to a hefty $2.36 billion. To put this in stark contrast, Bitcoin ETFs have experienced the opposite trend, pulling in over $36 billion since January of last year. It’s a tale of two coins with diverging investor sentiment right now.
Unsurprisingly, analysts are becoming increasingly pessimistic about Ethereum’s price prospects. Just last month, Standard Chartered, for example, revised its ETH price forecast downwards, slashing it by a significant 60% to a target of $4,000. This reflects a growing sense of caution surrounding ETH’s near-term performance.
And if all that weren’t enough, ETH is also caught in the crosswinds of broader market anxieties. The market is currently gripped by “extreme fear,” partly triggered by Trump’s recent announcement of reciprocal tariffs which have amplified concerns about a potential recession on the horizon. This macroeconomic uncertainty is adding further pressure to Ethereum’s already fragile position.
Technical Analysis: Ethereum Chart Suggests Potential Drop to $1,000
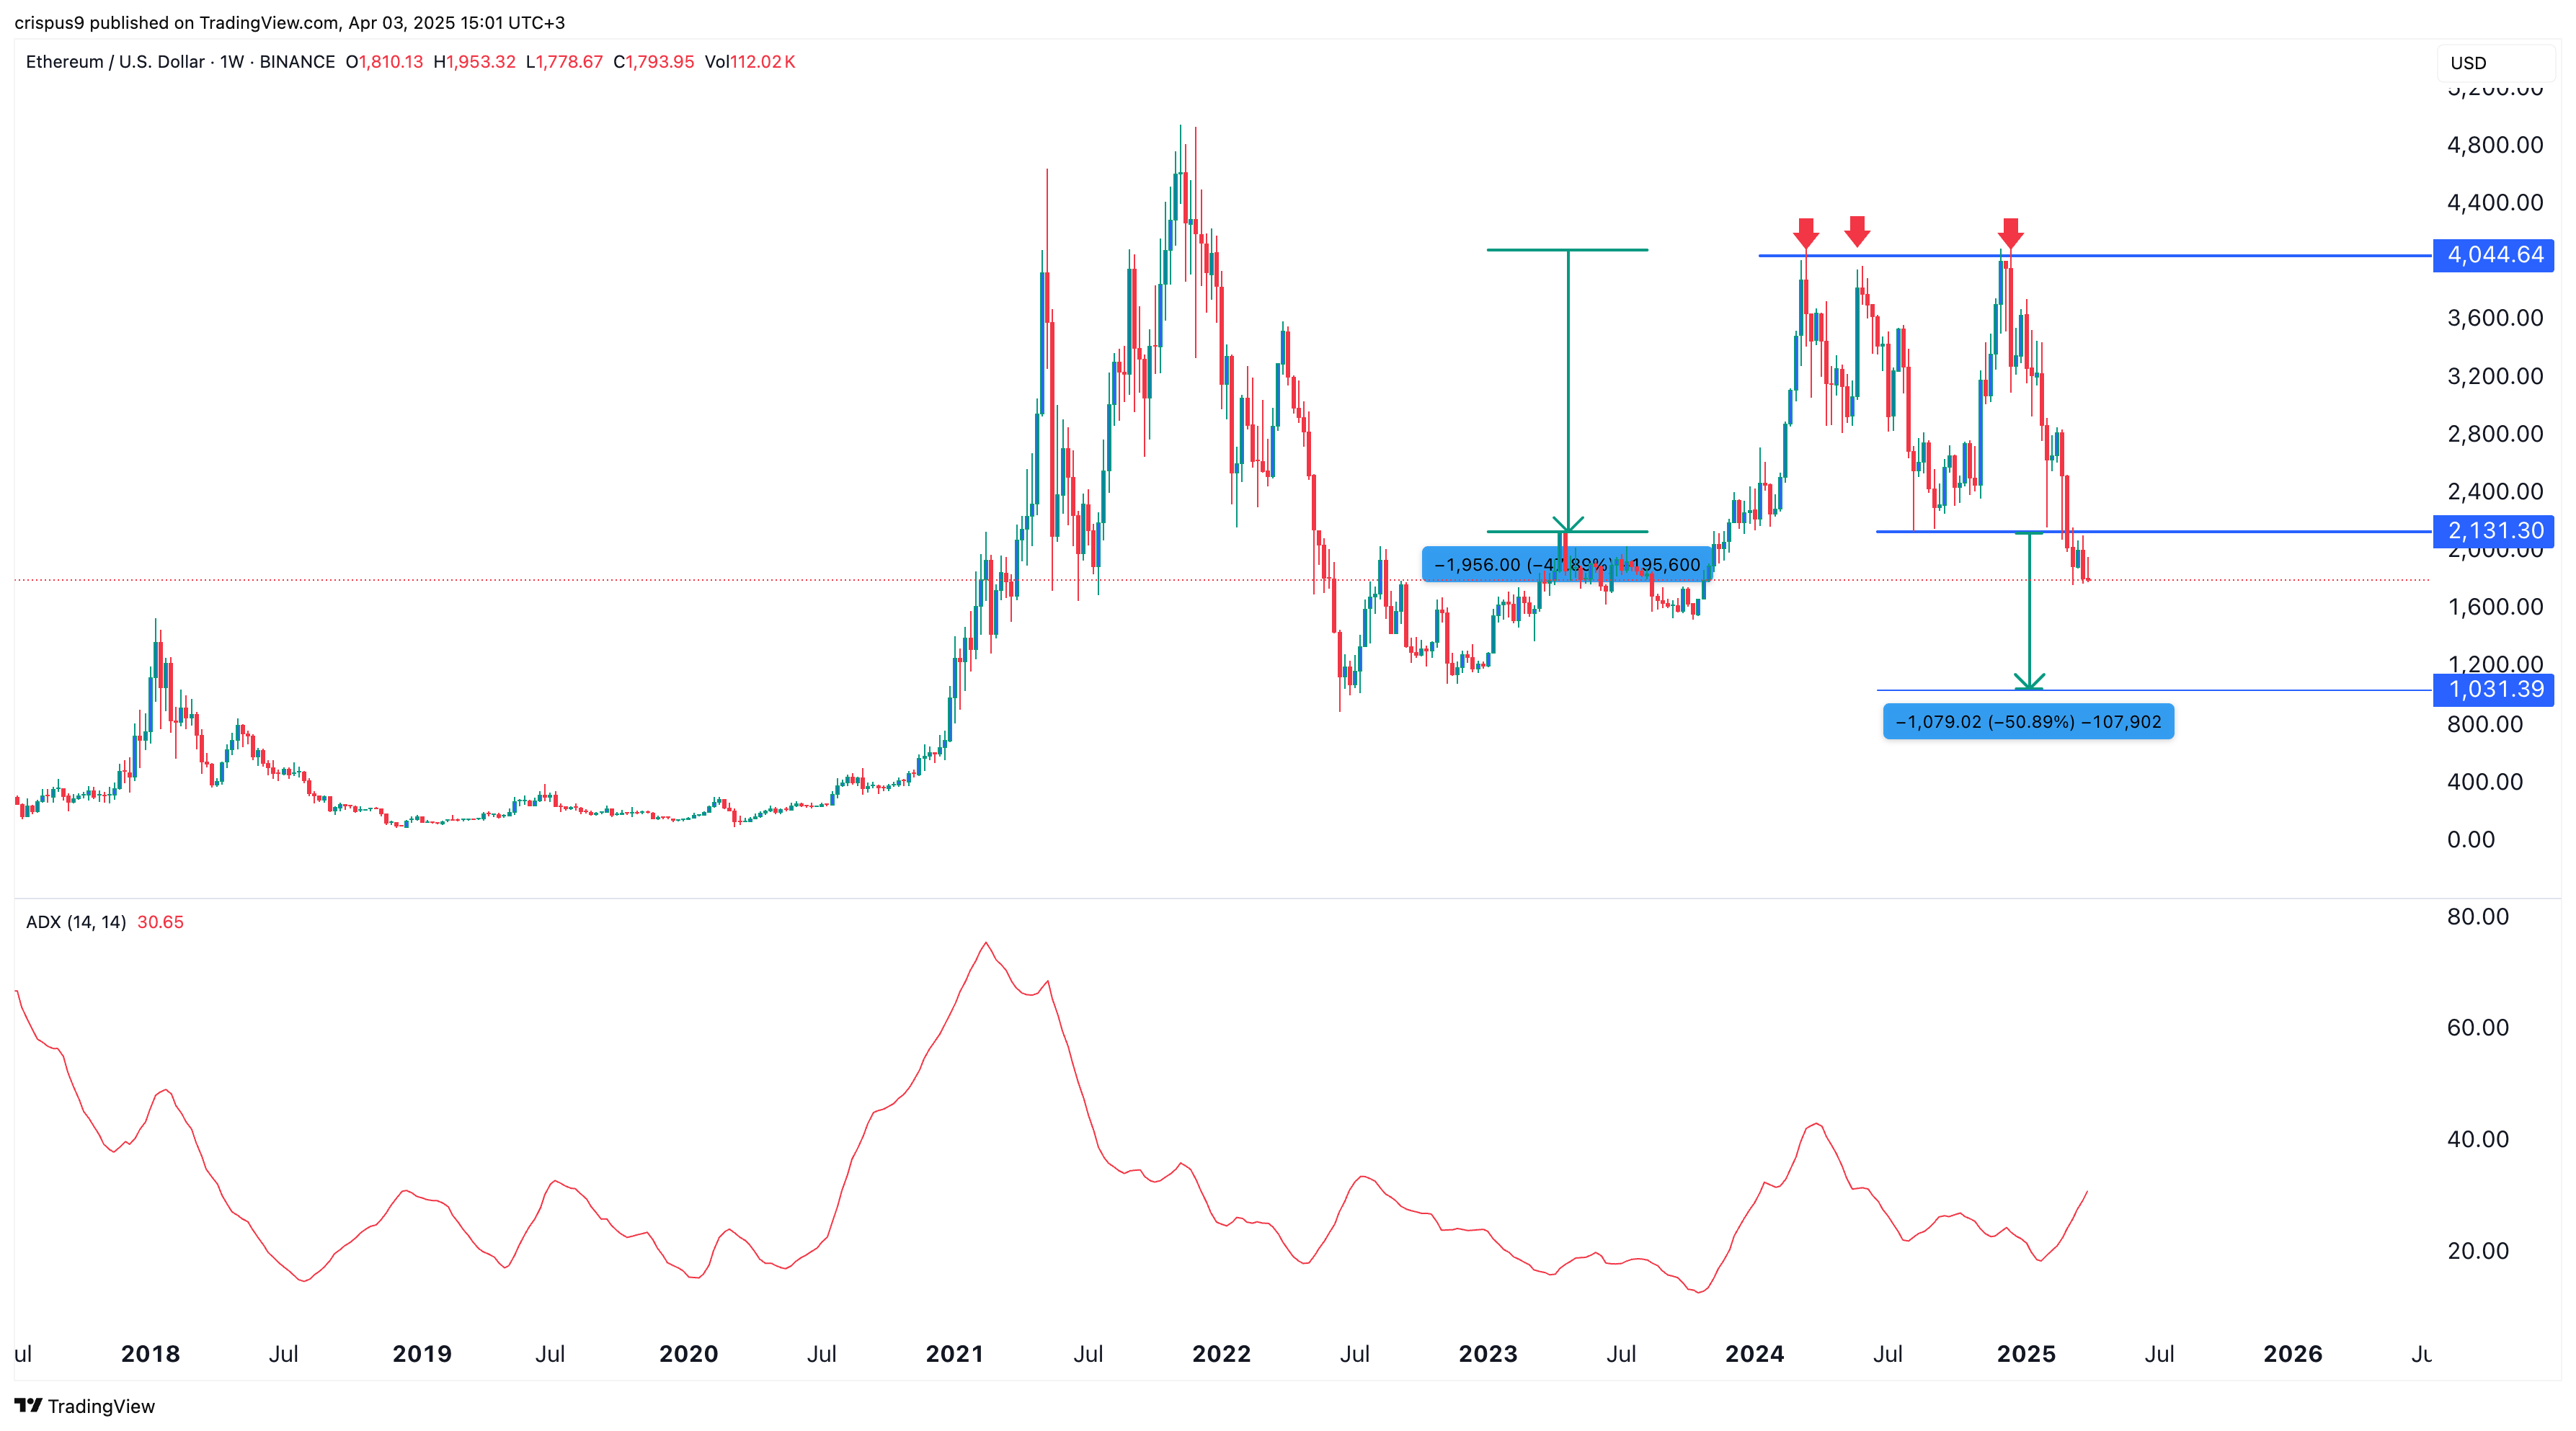
Taking a closer look at Ethereum’s weekly price chart reveals a worrying pattern that suggests further price declines could be on the way. Specifically, Ethereum appears to have formed a “triple-top” pattern between March 11th and December 16th of last year. For those unfamiliar, a triple-top is a bearish chart formation characterized by three peaks at roughly the same price level, with a defined “neckline” below the peaks.
In Ethereum’s case, these peaks clustered around the $4,045 level, while the neckline sat at approximately $2,130. Crucially, the price has now broken decisively below this neckline, confirming the bearish implications of this pattern. Adding to the bearish outlook is the Average Directional Index (ADX), a popular technical indicator that measures the strength of a price trend. The ADX has surged to 30, signaling that the downward trend is not only in play but is also gaining momentum.
To estimate a potential price target based on this triple-top pattern, we can measure the vertical distance between the peaks and the neckline. This distance, roughly 50%, projected downwards from the neckline, points to a potential crash down to the $1,000 level. That would represent a further 42% drop from Ethereum’s current price.


However, it’s important to remember that technical analysis is not foolproof. On the other hand, if Ethereum manages to climb back above the crucial resistance level of $2,130 – the neckline of that triple-top pattern – this bearish scenario would be invalidated. Such a move could instead increase the likelihood of a rebound, potentially pushing the price towards the $2,500 mark. So, all eyes are on that $2,130 level as a key determinant of Ethereum’s next move.
Frequently Asked Questions (FAQs)
What’s behind the potential risk of an Ethereum price crash?
What are the concerning fundamental indicators for ETH?
What would it take for Ethereum’s price to recover?
Disclaimer: The presented content may include the personal opinion of the author and is subject to market condition. Do your market research before investing in cryptocurrencies. The author or the publication does not hold any responsibility for your personal financial loss.


