
Analyst Explains Why “The Clock Is Ticking” For XRP

Why You Can Trust Us
We follow a strict editorial policy, always focusing on accuracy, relevance, and keeping things fair and balanced.
Our content is crafted by seasoned industry experts and thoroughly checked.
We hold ourselves to the absolute highest standards in reporting and publishing.
Strict editorial policy that focuses on accuracy, relevance, and impartiality
Morbi pretium leo et nisl aliquam mollis. Quisque arcu lorem, ultricies quis pellentesque nec, ullamcorper eu odio.
You can also find this article available in Spanish.
It looks like the long period where the XRP price hasn’t moved much might be coming to a head soon. That’s according to market expert CasiTrades (@CasiTrades). Sharing an update on X, the analyst pointed out that “XRP’s setup has not changed – but the clock is ticking,” emphasizing that the token is still stuck in the same price range it’s been in since early April.
Why The “Time Is Ticking” For XRP
Looking at the one‑hour Binance chart shared by CasiTrades, XRP was sitting at $2.07. An earlier try at a rally didn’t quite make it, stopping exactly at the 0.618 Fibonacci level from the March‑to‑April dip, which was marked at $2.118 on the chart. The analyst explained, “XRP attempted a breakout alongside BTC but stalled at the 0.618 retracement, which is a common level for exhaustion. The rejection came fast, and now momentum is pulling us back toward support.”
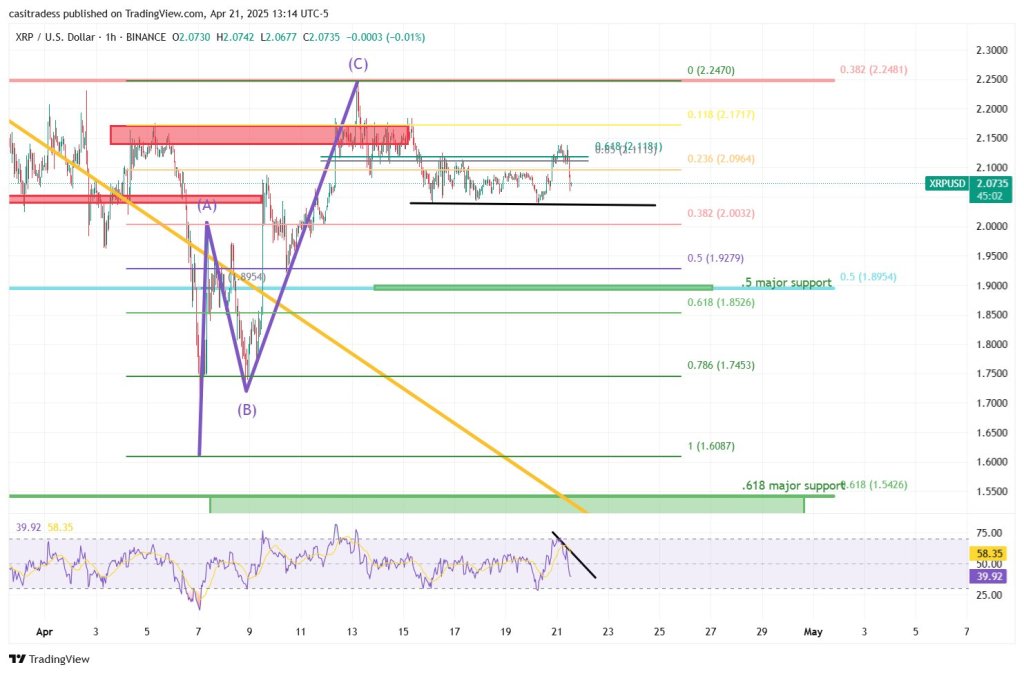
Adding to that resistance are horizontal areas of selling pressure between $2.10 and $2.17. Looking downwards, we see layers of support levels in the medium term: the 0.5 retracement ($1.90) and the deeper 0.618 level ($1.55). Both of these are marked in green and labeled as “major support.” The relative‑strength index (RSI) below the main chart shows a short‑term bearish sign – the price is flat while the RSI is moving lower. This suggests the latest price move up might be losing steam before it even reaches overbought levels.
Related Reading
Casi mentioned that “Nothing about the bigger picture has changed. In fact, this just reinforces what I have been saying, we likely still need to sweep major supports like $1.90 or $1.55 before XRP is ready to break out. This should not continue to drag on… Momentum in crypto shifts quickly. We could tag those support levels and launch into Wave 3 very very soon.”
She sees the overall price action fitting a classic Elliott Wave corrective pattern. The sharp three‑part “ABC” drop from the early‑April high wrapped up mid‑month. Since then, the market has been carving out what she still believes is Wave 2 within a much bigger upward move. “XRP is still in Wave 2. Everything still supports a macro breakout. Until then, I am watching key levels and letting it play out,” the analyst commented.
Related Reading
When a follower asked if a move down to $1.55 would happen quickly, CasiTrades responded: “Yes I do think if it goes for $1.55 it would be a fast recovery. The purpose of it would be to break resistances above by using that recovery momentum.” She also shared her own strategy: putting unused funds to work at $1.90 and managing risk with a stop-loss order after the first bounce happens.
Part of the analyst’s confidence comes from analyzing Fibonacci time‑zones, a framework she first shared earlier this month. This approach, which is now in its third predicted phase, still suggests there’s time for a powerful Wave 3 surge to kick off before the end of April. She emphasized, “Momentum in crypto shifts quickly. We could tag those support levels and launch into Wave 3 very very soon!” The potential price targets, based on standard Fibonacci extensions, haven’t changed: $6.50 (the 1.618 level), $9.50 (the 2.618 level, which she calls “most likely”), and “$12+” at the 3.618 extension.
So, for the moment, XRP finds itself caught between resistance overhead at $2.24 (which is the 0.382 retracement level and the top of the potential Wave C) and support grouped around $1.90. CasiTrades mentioned that until either side of this range is clearly broken with strong volume, “nothing about the bigger picture has changed.” However, she cautioned that the opportunity for a decisive move this April is shrinking, noting, “This should not continue to drag on… We are still in Fib Time Zone 3 according to that analysis.”
As we write this, XRP was trading at $2.07.
Featured image created using DALL.E, chart data courtesy of TradingView.com


