
Bitcoin: $90K Resistance – 3 Reasons

After hitting a weekly peak of $88,752 back on March 24th, Bitcoin’s price
has been tracing a pattern of lower peaks and valleys on the hourly chart.
With the week winding down, Bitcoin hasn’t managed to climb back above that $88,000 resistance level. This makes it look less likely we’ll see another try at $90,000 before the quarter ends.
Bitcoin 1-hour chart. Source: Cointelegraph/TradingView
Why is Bitcoin Stalling Below $90K?
One big factor holding Bitcoin back right now is consistent selling pressure. This is coming from short-term holders (STHs), or those investors who’ve held their coins for less than 155 days. Glassnode’s insightful newsletter, “The Week On-chain,” pointed out that this Bitcoin cycle is a bit “top heavy.” What that means is, a lot of Bitcoin is in the hands of investors who bought in at higher prices. Because of this, the short-term holder group is feeling the most pain from the price drop we’ve seen since Bitcoin’s 30% correction from its all-time high.
According to Glassnode’s analysts in their report,
“The amount of Bitcoin held by short-term holders that’s now in loss has jumped to a massive 3.4 million BTC. That’s the largest amount of STH-held Bitcoin in loss since way back in July 2018.”
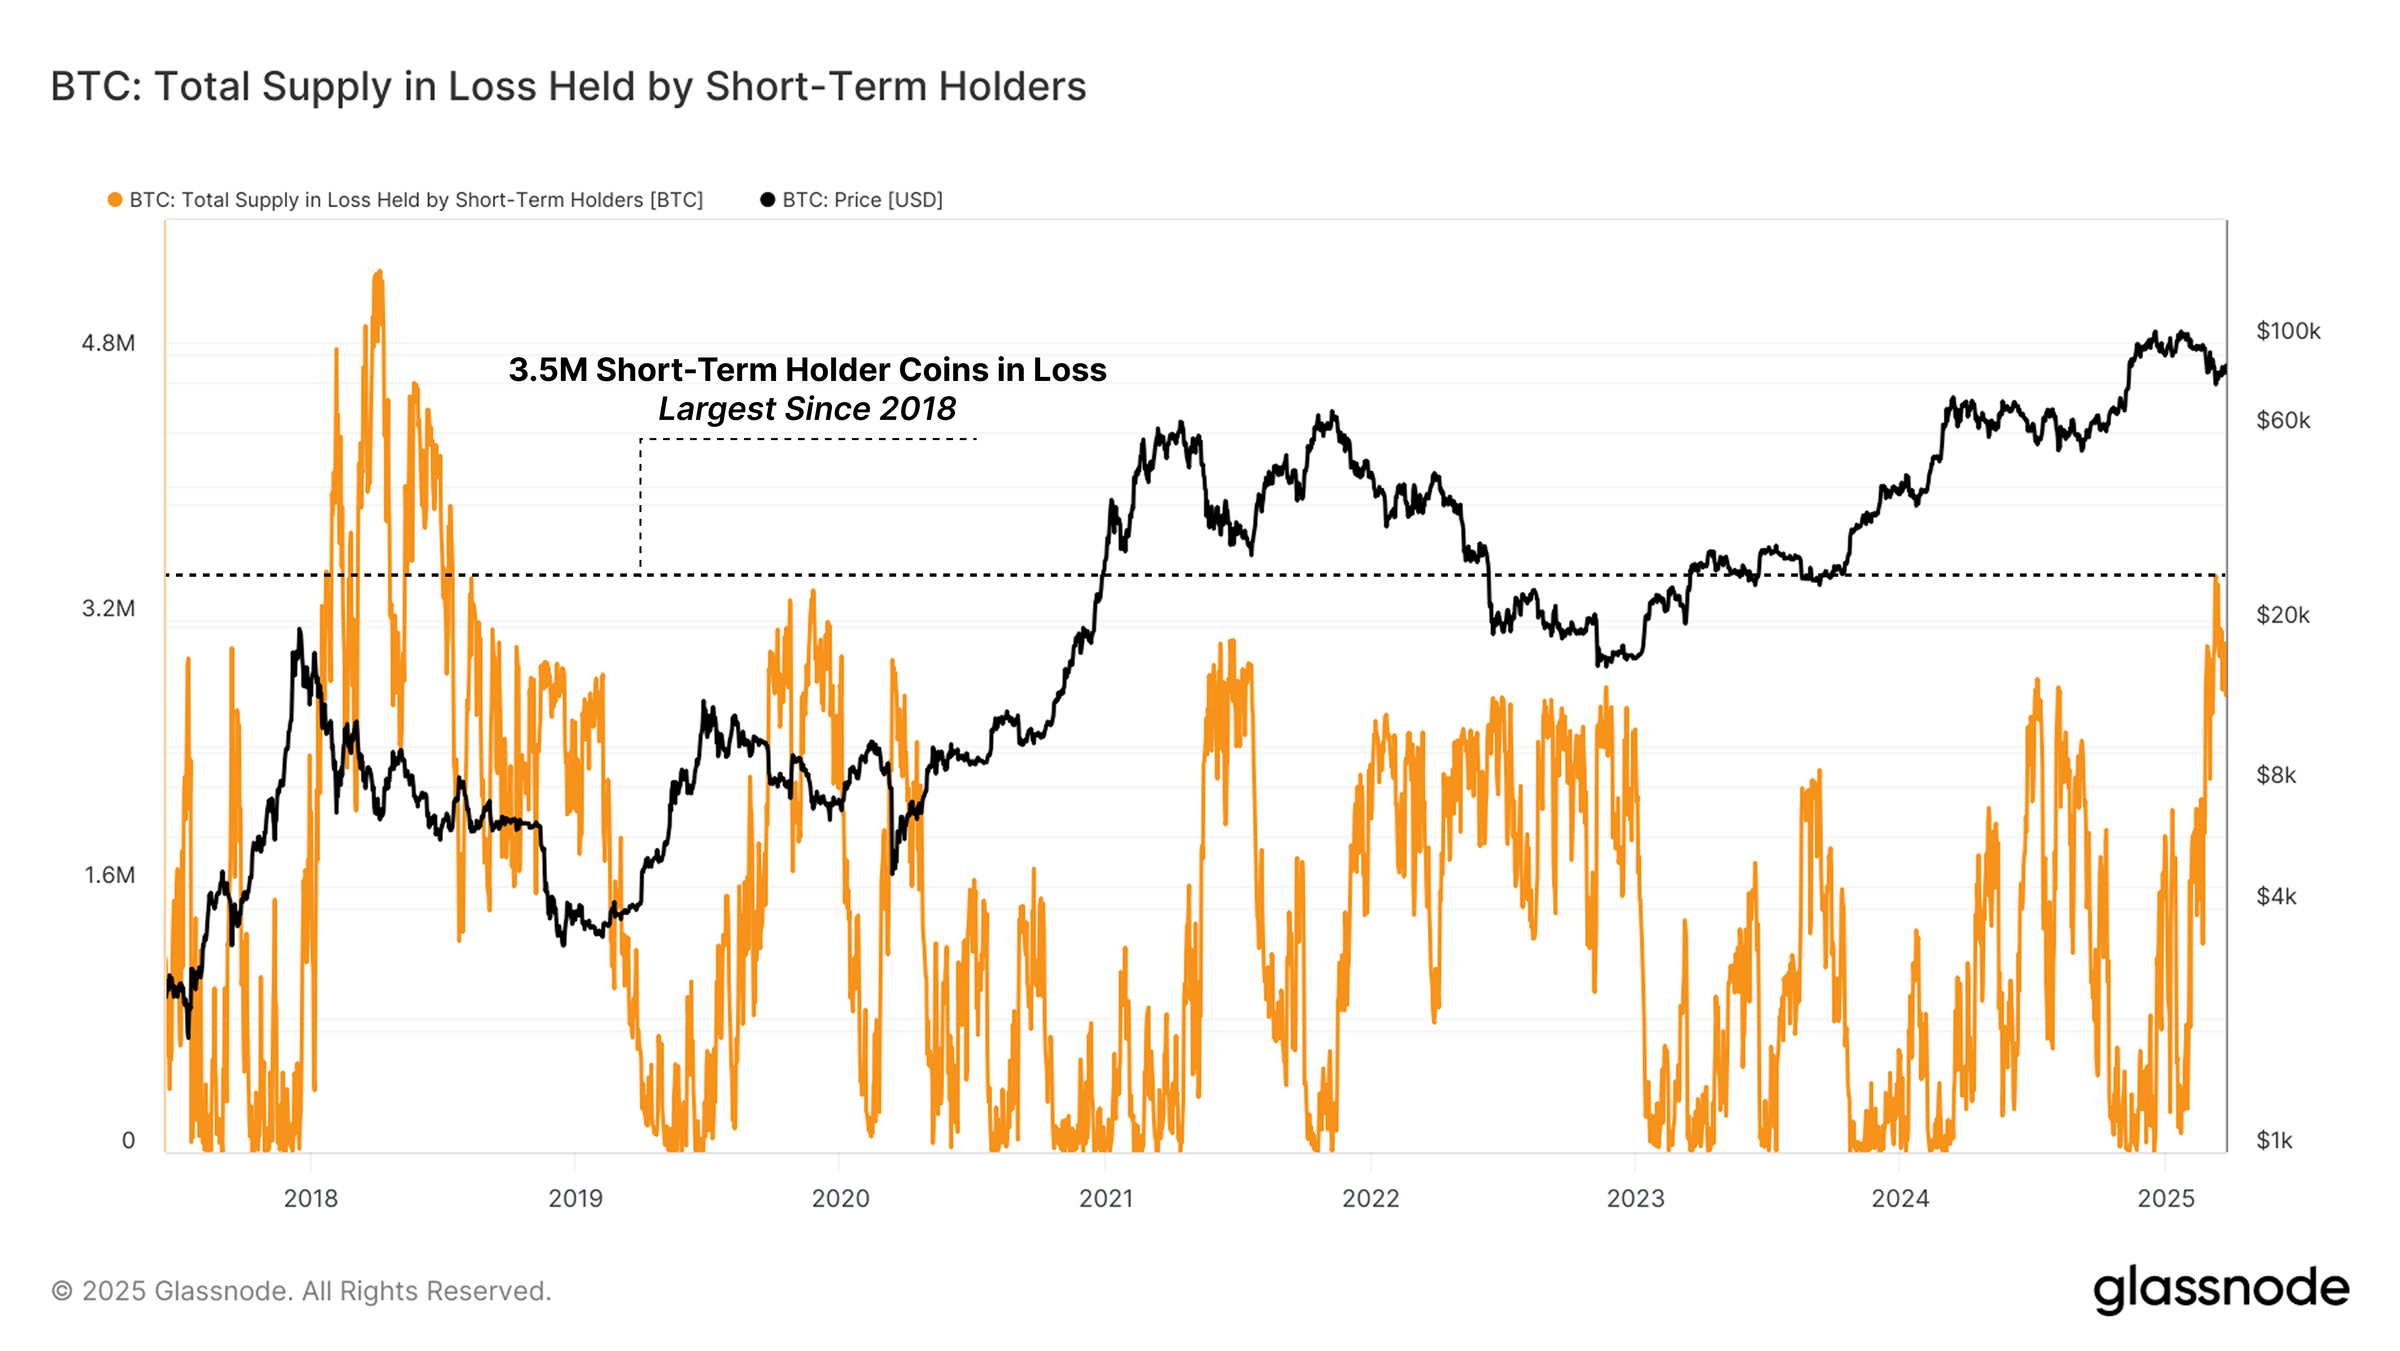
Bitcoin total supply in loss held by STHs. Source: Glassnode
You can see this short-term holder selling pressure reflected in Bitcoin’s accumulation trend score.
This accumulation trend score, which is basically a measure of selling pressure, has stayed below 0.1 ever since Bitcoin’s price slipped from $108,000 down to the $93,000-$97,000 zone. When the score is under 0.5, it usually signals distribution (meaning selling) rather than accumulation. And a score below 0.1? That really highlights strong selling pressure.
Another thing making it tough for Bitcoin to crack $90,000 is tighter liquidity in the market. Data indicates that on-chain transfer volumes have fallen to $5.2 billion per day. That’s a significant 47% plunge from the peak we saw during the rally to those all-time highs. Similarly, the number of active addresses has also shrunk by 18%, going from 950,000 in November 2024 to 780,000.
At the same time, the open interest (OI) in the Bitcoin futures market has also dropped, by 24%, from $71.85 billion down to $54.65 billion. Even the perpetual futures funding rates have cooled off.
This combination of less leverage and tighter liquidity – along with the fact that only a tiny 2.5% of the total Bitcoin supply is moving at a profit during this correction – is limiting the market’s ability to push past $90k. Simply put, there aren’t enough buy orders to soak up all the sell orders right now.
Related: Bitcoin price prediction markets bet BTC won’t go higher than $138K in 2025
Is New Bitcoin Demand Still Weak?
Glassnode’s data also points out that this current Bitcoin bull run is missing fresh demand – new buyers coming into the market. Their Cost Basis Distribution (CBD) Heatmap shows a concentration of supply at higher price levels ($100K-$108K), but we’re not seeing a strong wave of new buyers at these lower levels to kickstart a price recovery.
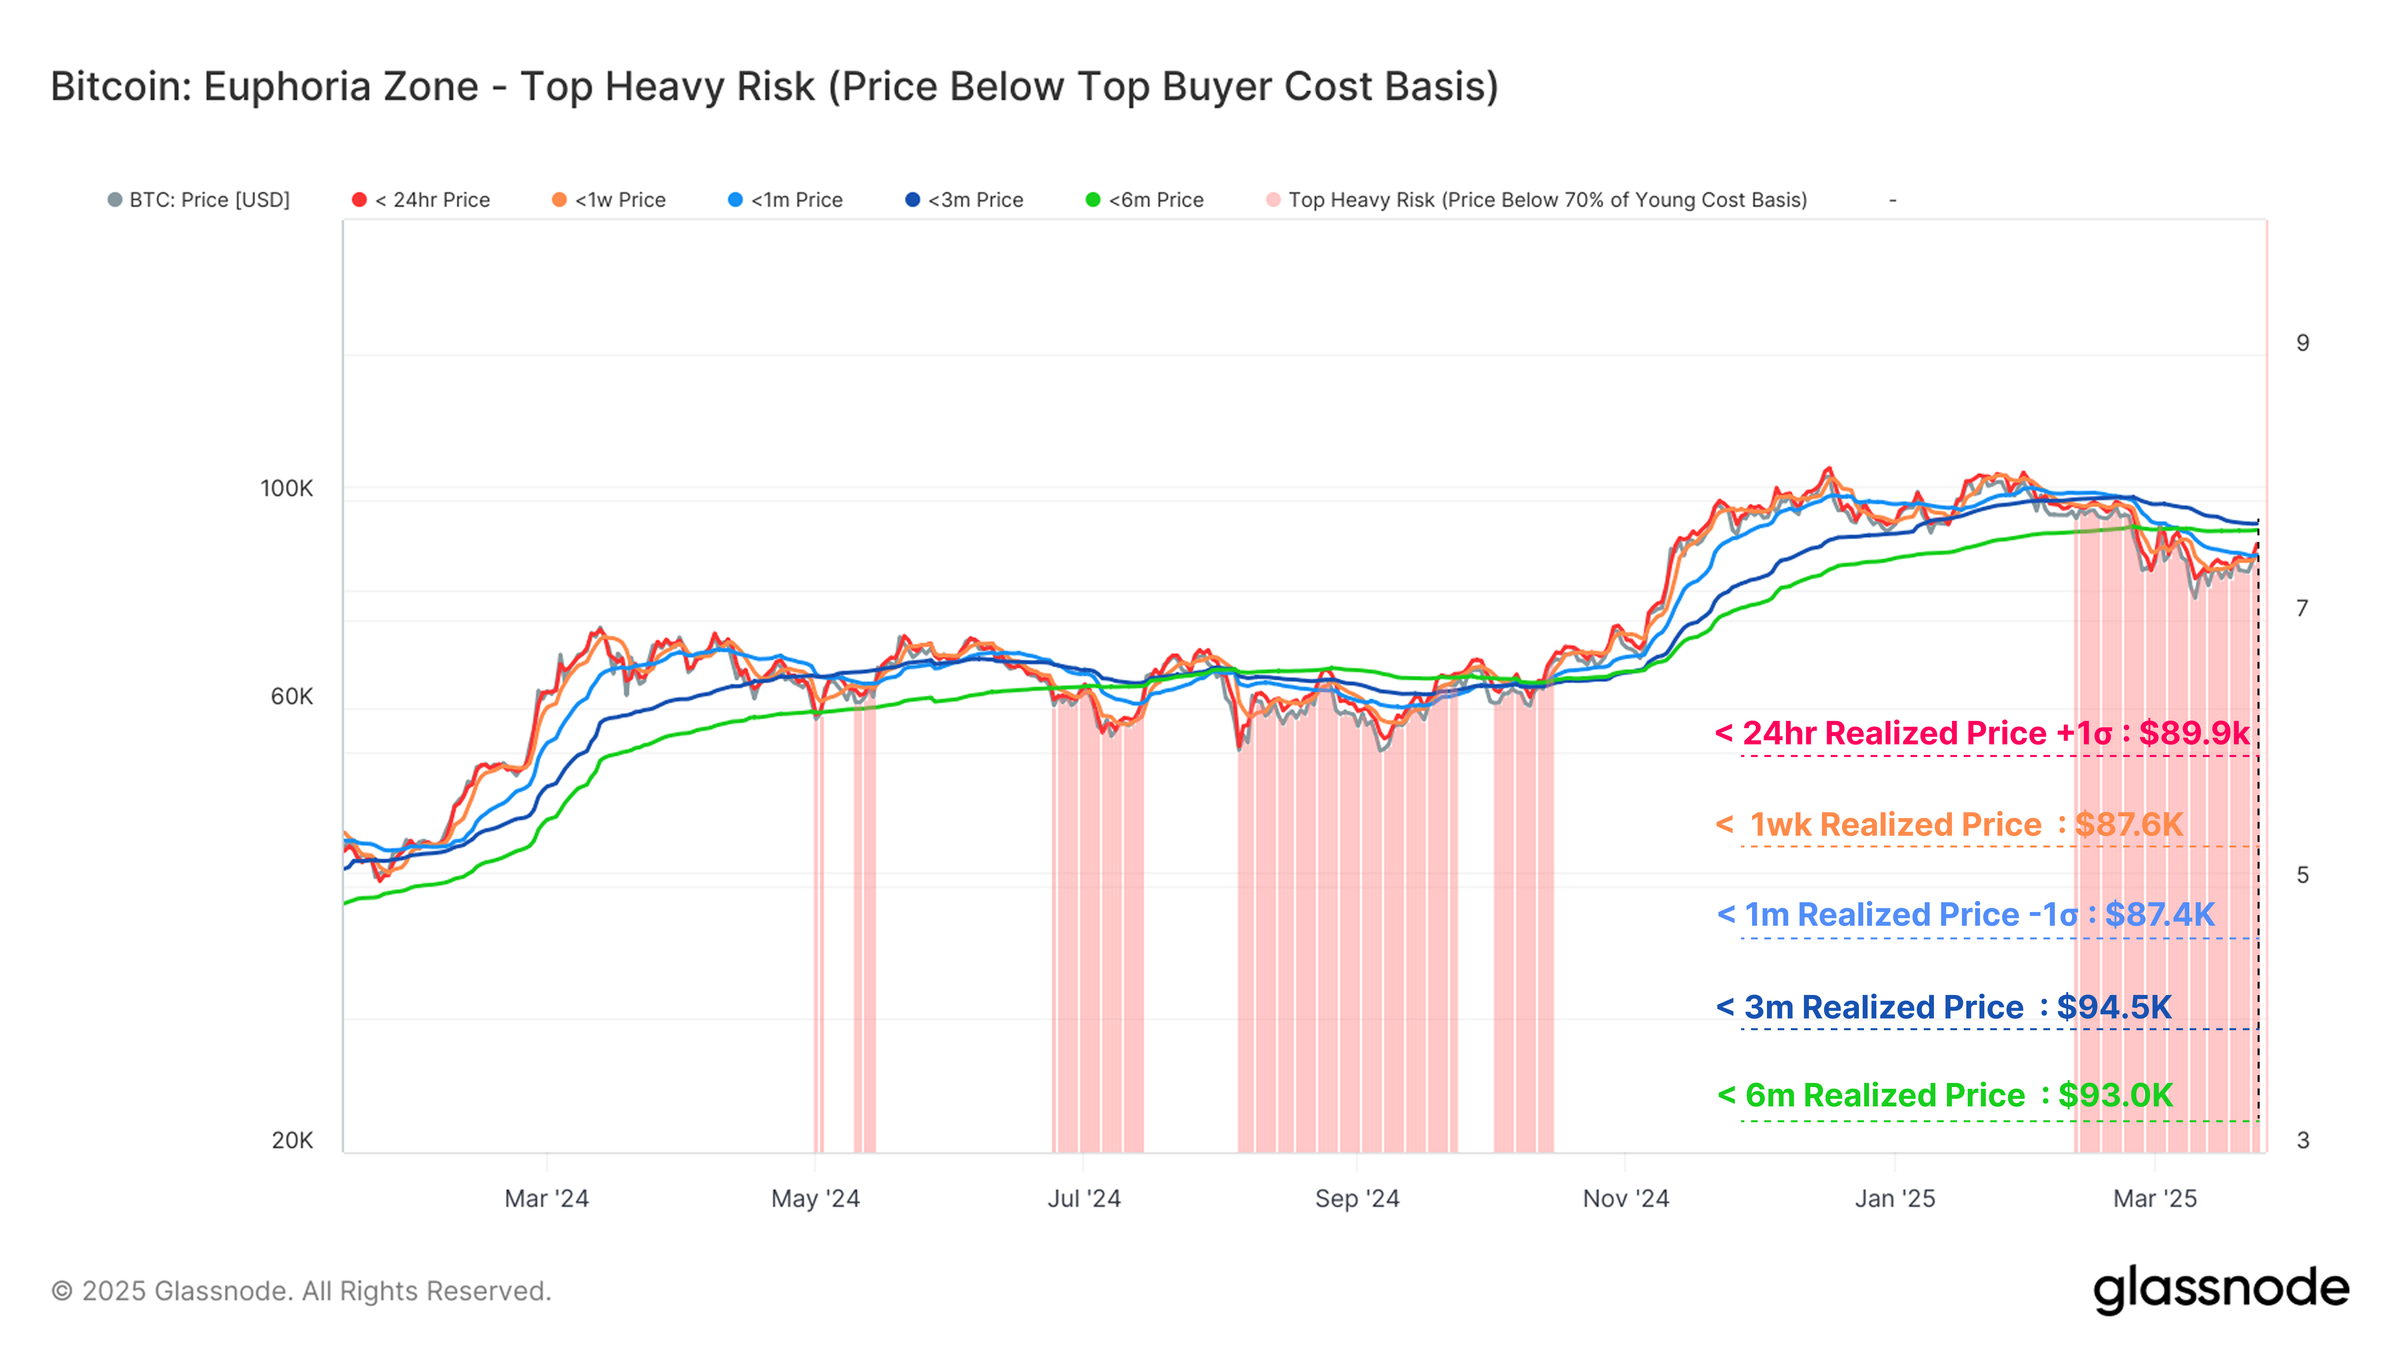
Bitcoin Euphoria Zone, Top Buyer Cost Basis. Source: Glassnode
This lack of new demand is made worse by the overall uncertain economic situation. This macro uncertainty is likely discouraging new investors, and we can see this in the shift to net capital outflows when the cost basis for short-term holders (1-week to 1-month) dipped below the cost basis for slightly longer-term holders (1-month to 3-month).
However, Glassnode analysts also noted a brighter side:
“On the other hand, long-term holders are still holding onto a significant chunk of the network’s wealth – almost 40% of the total invested value.”
Essentially, these periods of drawn-out accumulation can eventually tighten up the available supply. And that could set the stage for better conditions and a new surge of demand once the market establishes a stronger uptrend.
Related: Would GameStop buying Bitcoin help BTC price hit $200K?
This article is for informational purposes only and should not be considered investment or trading advice. Remember, all investing and trading carries risk, so it’s important for you to do your own research before making any decisions.


