Bitcoin Resistance at $85,000: Whale Buying Dip Stalls Price
Bitcoin (BTC) saw a bit of a jump after the latest FOMC meeting, but it looks like that upward momentum is fading. The price is now correcting, dipping nearly 3% in the last 24 hours, and finding it tough to break through key resistance levels as short-term momentum wanes.
Looking at technical indicators like the Ichimoku Cloud and EMA lines, we can see signs that BTC might face some challenges ahead. Meanwhile, after a period of strong accumulation, Bitcoin whale activity has become more stable. This raises some interesting questions about whether BTC has enough gas in the tank to climb back to higher levels this month.
BTC Ichimoku Cloud Shows Challenges Are Coming
Currently, Bitcoin is trading below the Ichimoku Cloud. For technical analysts, this typically signals a bearish trend in the short term. Adding to this picture, the price has also dropped below both the Tenkan-sen (blue line) and Kijun-sen (red line), further emphasizing the pressure pushing downwards.
If you look ahead in the cloud formation, it appears thin and flat. This often suggests that momentum is weak and we might see sideways trading or even further declines, unless Bitcoin can manage to climb back up and reclaim higher price points.
The Lagging Span – that’s the green line – is also positioned below the price action and the cloud. This further confirms the overall bearish feeling in the market. However, the price is getting close to the lower edge of the cloud’s boundary, and this area could potentially act as a level of immediate support.
If buyers can’t defend this support zone, we might see the bearish momentum gain even more traction. On the other hand, if Bitcoin can push back up above the Tenkan-sen and Kijun-sen lines, that could be an early indication of a possible recovery. But, it’s worth noting that the cloud resistance above still presents a significant hurdle to overcome.
Bitcoin Whales Are Now More Stable After A Recent Surge
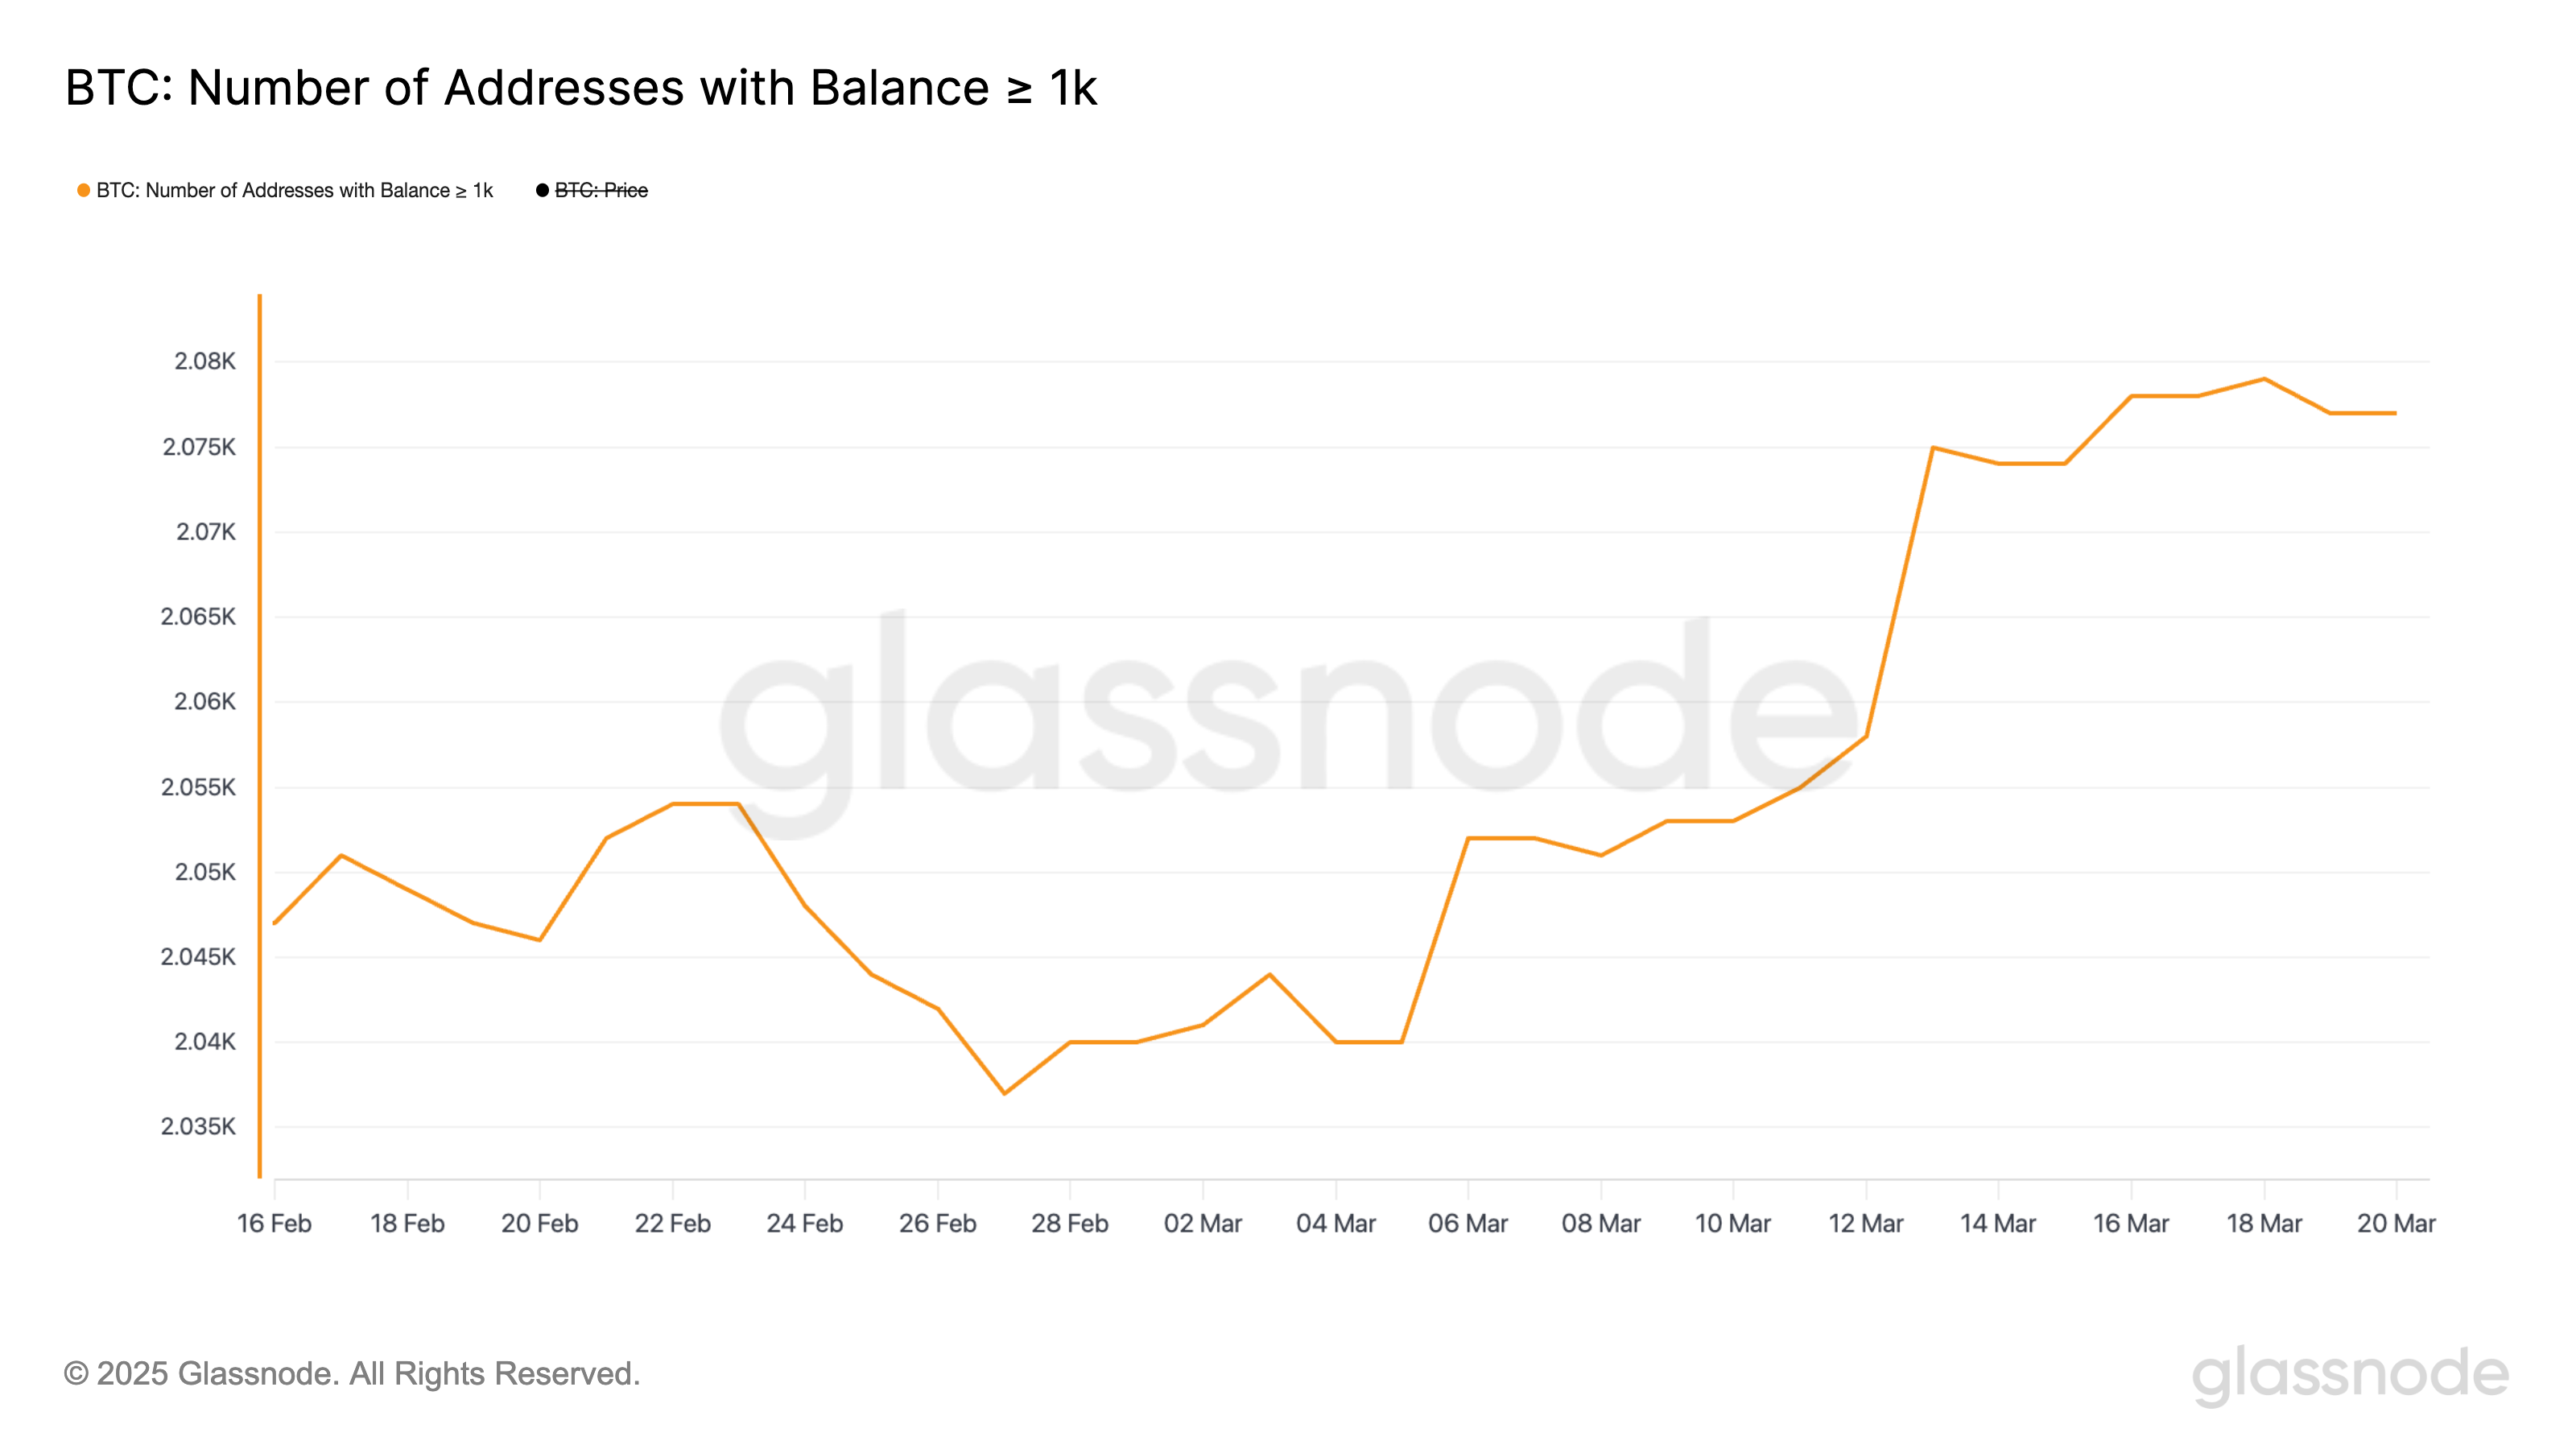
We’ve seen a recent surge in the number of Bitcoin whales – those big players holding substantial amounts of BTC. Wallets containing at least 1,000 BTC increased from 2,040 on March 5th to 2,079 by March 18th. This jump marked the highest number of whales since mid-December 2024, indicating strong accumulation activity.
While this sharp increase pointed to significant accumulation during that period, the number of whales has since stabilized slightly, hovering around 2,077 over the last few days. This suggests that the pace of accumulation by these large holders has cooled off for the moment.

It’s really important to monitor whale activity because these large holders have the potential to significantly impact Bitcoin’s price due to the sheer size of their holdings. Often, an increasing number of whales can be a sign of growing confidence among major investors, which can, in turn, lead to upward pressure on the price.
The recent increase in whale addresses might suggest that institutional investors or high-net-worth individuals are positioning themselves for a possible price rally. Alternatively, they could simply be taking advantage of perceived dips or accumulating during consolidation phases, which aligns with what we’ve seen happening with BTC in recent weeks.
Can Bitcoin Return Above $90,000 In March?
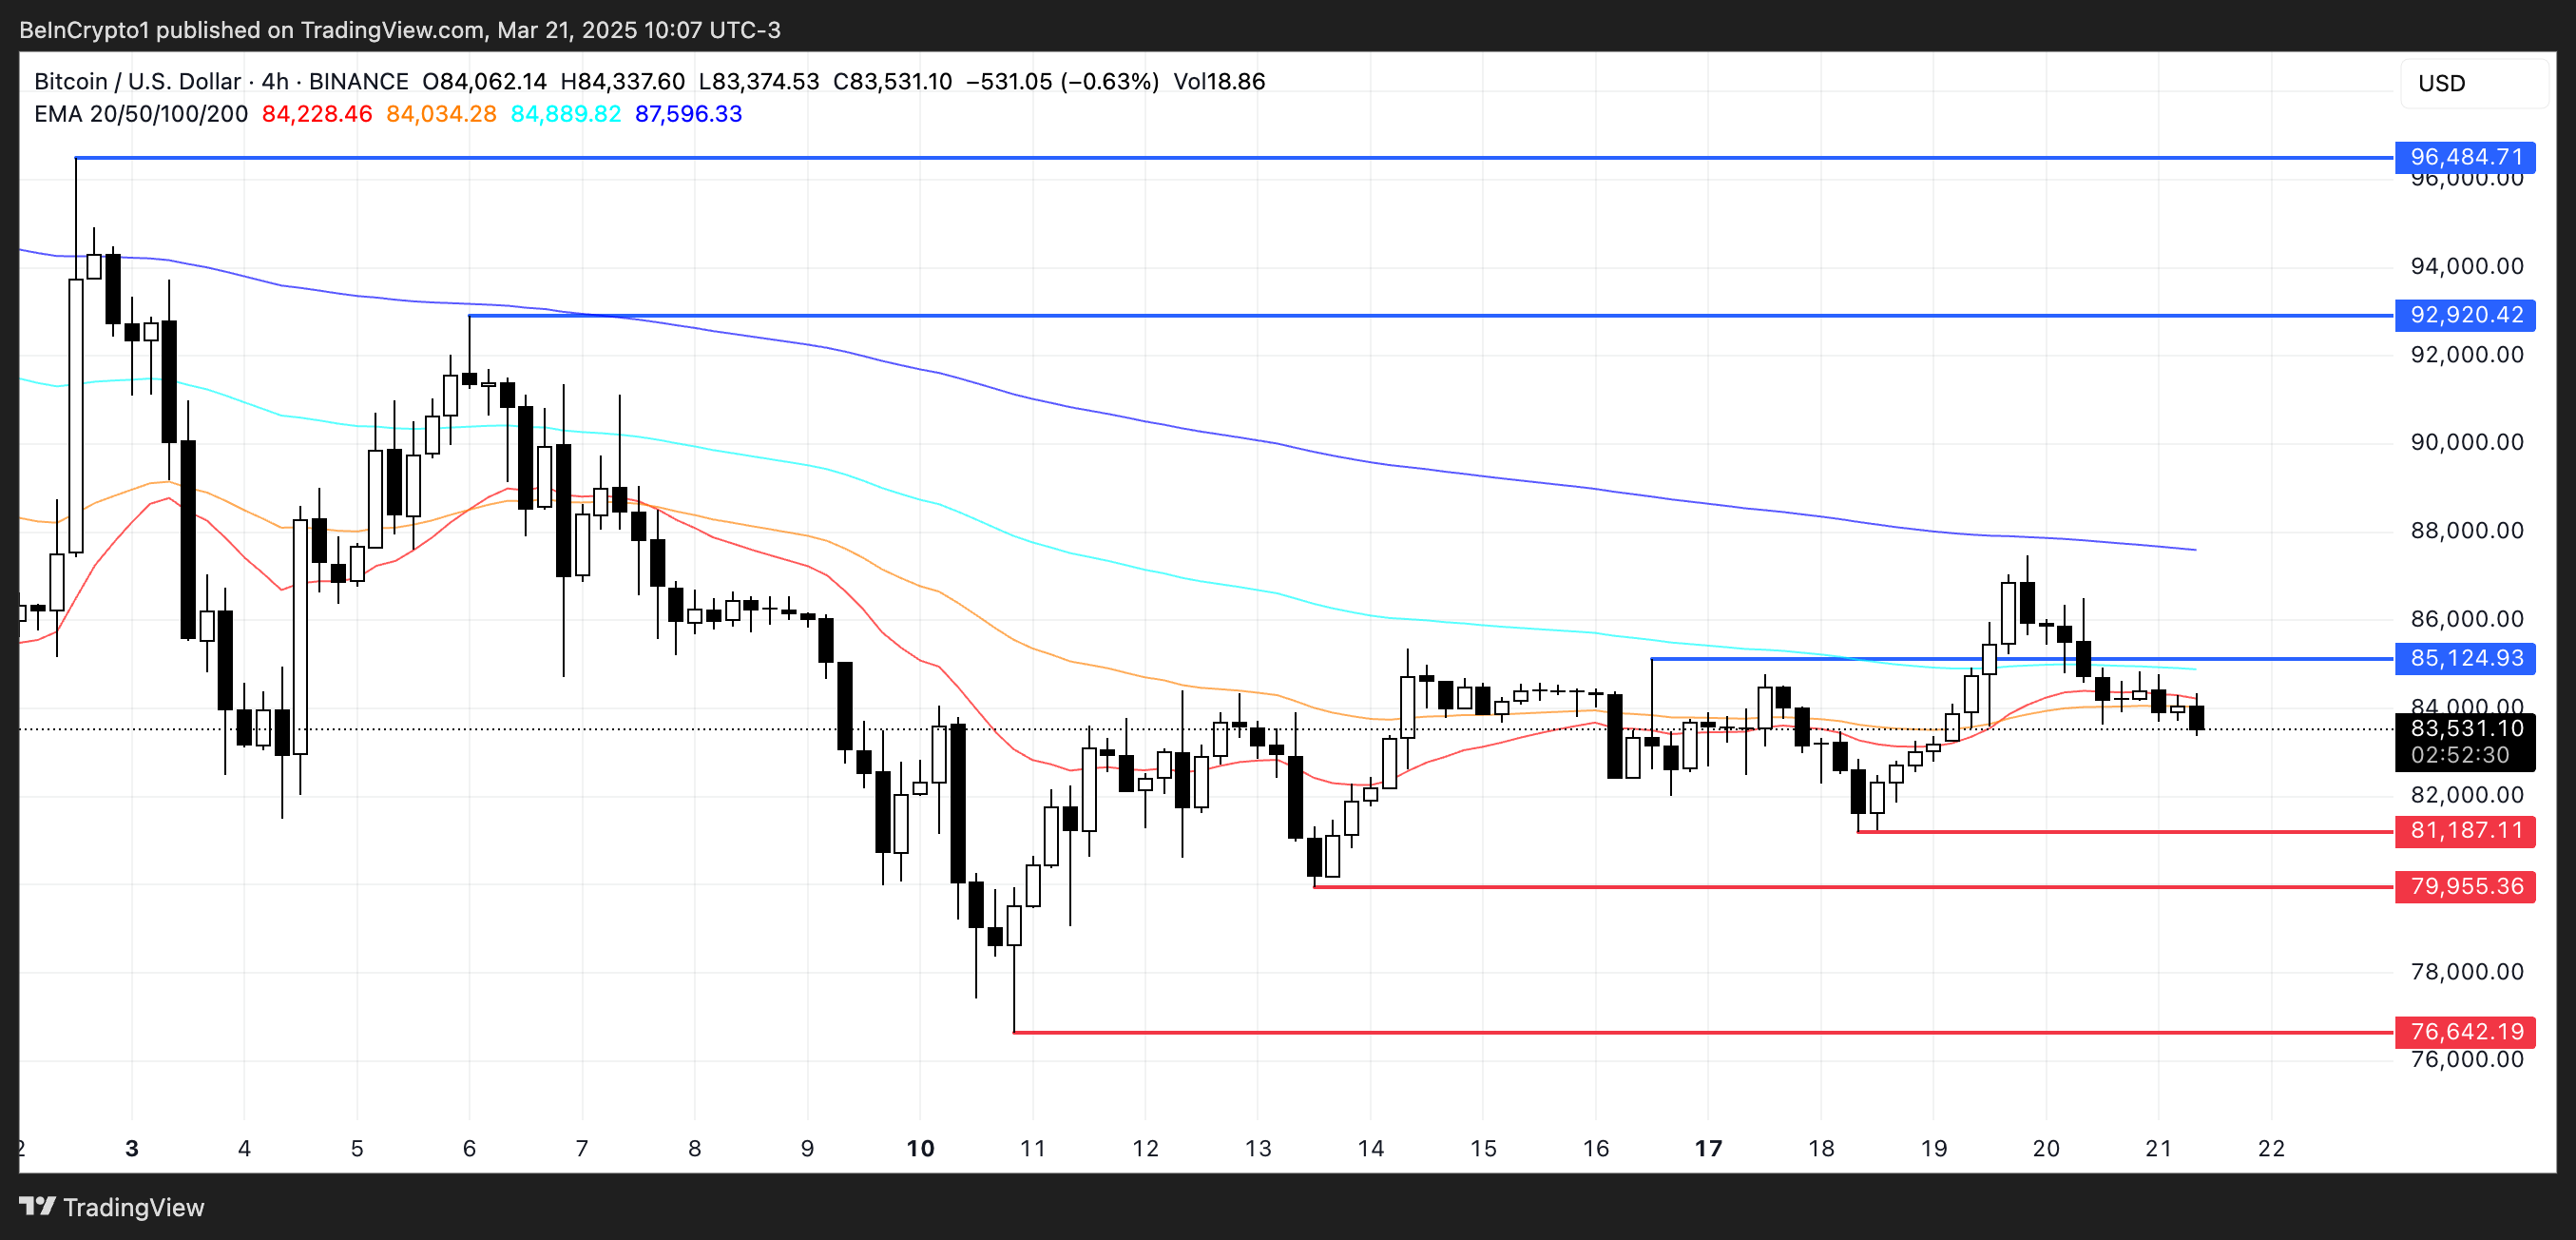
Right now, Bitcoin’s price is consolidating as it trades between a resistance level at $85,124 and a support level at $81,187. Looking at the EMA lines, they’re moving closely together, indicating a lack of clear direction at the moment. That initial price jump we saw following the FOMC meeting seems to be running out of steam. This aligns with the views of Nic Puckrin, who suggests that the recent rally might be short-lived based on the current state of the market:
“The slight “Powell pump” we saw in crypto markets after (…) FOMC meeting has brought Bitcoin back above its 200-day moving average, which is certainly a bullish sign. Whether it can continue on this trajectory, however, is another question. If BTC does continue its current surge, a key resistance level to watch will be around $92,000-$93,000. If it manages to break out above this, we could see it extend the rally toward its previous all-time high. However, there is likely too much uncertainty in markets to provide the necessary support for such a move,” Puckrin told BeInCrypto.

If Bitcoin can successfully break above that $85,000 resistance area, it could pave the way for a move towards $92,920, or even potentially $96,484 if bullish momentum really picks up.
However, if Bitcoin fails to hold the support level at $81,187, we might see a downward move towards $79,955. If sellers take stronger control, there’s a risk of further decline, potentially down to $76,642.
Disclaimer
Just a quick reminder that, in line with the Trust Project guidelines, this price analysis is for informational purposes only. It shouldn’t be taken as financial or investment advice. BeInCrypto is dedicated to providing accurate and unbiased reporting, but keep in mind that market conditions can change unexpectedly. Always do your own thorough research and talk to a financial professional before making any investment decisions. Also, please be aware that our Terms and Conditions, Privacy Policy, and Disclaimers have been updated.

