
Bitcoin: Triangle Formation Hints at 15% Price Breakout

Reason to trust
We have a strict editorial policy that puts accuracy, relevance, and fairness first.
Our content is created by experts in the field and carefully checked and re-checked.
We’re committed to the highest standards when it comes to reporting and publishing.
Strict editorial policy that focuses on accuracy, relevance, and impartiality
Morbi pretium leo et nisl aliquam mollis. Quisque arcu lorem, ultricies quis pellentesque nec, ullamcorper eu odio.
This article is also available in Spanish.
Bitcoin’s price is approaching a critical juncture as it consolidates within a narrowing triangle pattern, hinting at a potentially explosive breakout soon. This period of price tightening, hovering around $80,000 to $85,000, is shaping up as a textbook technical formation that often precedes significant market swings.
Interestingly, crypto analyst Ali Martinez highlighted this very triangle pattern in a recent analysis shared on X, the social media platform. He advised traders to keep a sharp lookout for Bitcoin’s anticipated breakout move.
Related Reading
This pattern suggests a possible price movement of 15% in either direction, and with Bitcoin currently trading near $83,000, the stakes are definitely elevated.
Triangle Pattern Emerges as Bitcoin Squeezes Between Falling Peaks and Rising Troughs
Martinez’s observation of this triangle formation focuses on Bitcoin’s price behavior since March 7th. On that day, Bitcoin experienced a brief dip from $91,000, dropping below $80,000. However, it then recovered above $80,000, subsequently creating a lower peak at $87,000 before another price correction.
Since then, Bitcoin’s price action has been characterized by a series of lower highs and higher lows, gradually compressing into an increasingly tighter range. This behavior is a telltale sign of a developing triangle pattern.
Bitcoin is currently trading right in the thick of this narrowing range. On the 4-hour chart, the triangle’s upper trendline is acting as resistance around $86,000, while the lower trendline provides support near $82,000. These levels have effectively contained Bitcoin’s price for the last few weeks. Looking ahead, a clear break beyond these boundaries could well determine Bitcoin’s direction in the short term.
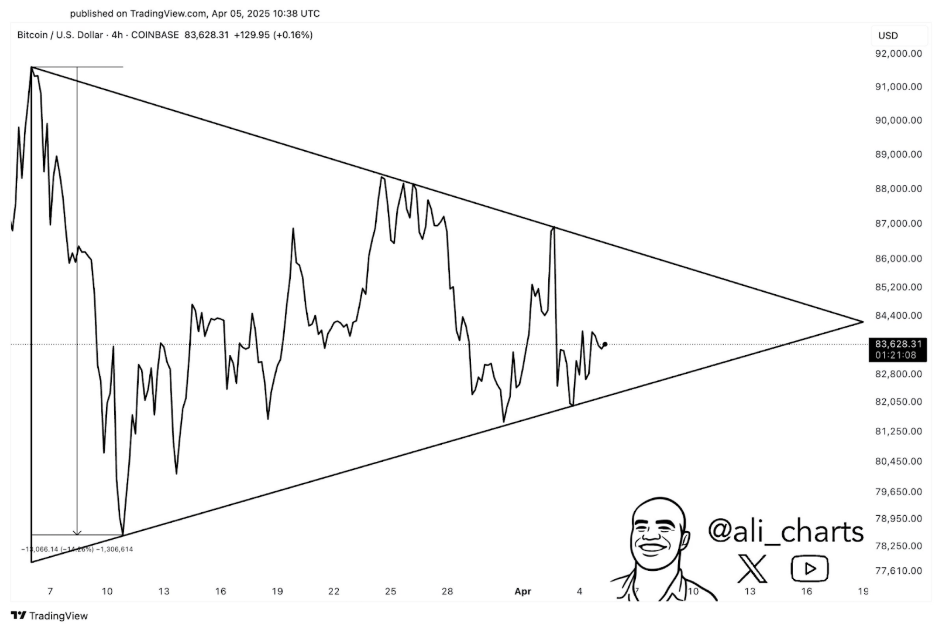
Image From X: @ali_charts
Analyst Predicts a 15% Move, Urging Traders to Pay Attention
Martinez’s analysis suggests that a considerable price change is on the horizon once Bitcoin breaks out of this triangle formation. “#Bitcoin $BTC is currently tightening within a triangle pattern, which could lead to a 15% move. Keep a close eye on it for a breakout!” he posted on X. This warning carries weight, particularly for those involved in short-term trading and managing positions with leverage.

Should Bitcoin break above the $86,000 resistance level, it could trigger a surge towards $90,000 or even higher, potentially reigniting bullish market momentum. Conversely, if Bitcoin breaks below the $82,000 support level, we could see a swift decline towards $70,000. Such a downturn would significantly dampen positive market sentiment and postpone hopes for predictions of reaching new all-time highs.
Related Reading
While a drop to $70,000 would be a significant setback, its possibility shouldn’t be dismissed, especially as the current bull score is at a low of just 10. Right now, many investors are anticipating a bullish outcome and a move back above $100,000. However, analysis of key buy zones indicates that Bitcoin needs to decisively overcome the $85,470 and $92,950 levels before such a scenario can truly unfold.
As of writing, Bitcoin is trading at $83,070.
Featured image from Fortune, chart from TradingView


