Bull Run Launch?

EOS, a coin loved by many in the altcoin world, has suddenly sprung to life, showing a big jump in both price and energy. After chilling out for weeks, the EOS price is now turning heads with exciting bullish signs popping up on both the short-term (hourly) and long-term (daily) views. Let’s dig into this to see if this move is the real deal or just a quick fakeout.
EOS Price Prediction: Is the Hourly Chart Hinting at a Quick Turnaround?
Looking at the EOS/USD hourly chart, we’re seeing a classic bullish breakout in action. Starting with the Heikin Ashi candles, it’s clear things have changed. We’ve gone from a mix of confusing red and blue candles to strong green candles with hardly any lower tails – that’s a strong signal of bullish power within the day.
The Moving Average (MA) Ribbon, made up of the 20, 50, 100, and 200-period simple moving averages (SMA), is showing a textbook bullish setup too:
- The 20 SMA ($0.599) has jumped cleanly over the 50, 100, and 200 SMAs, which points to building upward pressure.
- The price has now broken way above the entire MA ribbon, currently around $0.6362, which suggests buyers are firmly back in charge.
Something else interesting going on is the Accumulation/Distribution Line (ADL), which is still sloping downwards, disagreeing with the price move. While this might make you pause, it often shows accumulation happening a bit behind the scenes, where price moves first before trading volume shows up. If the ADL levels out or starts to nudge upwards in the next few trading sessions, it could confirm some serious buying interest underneath.
This hourly chart is really pointing towards a strong short-term bullish reversal, with potential for a move towards testing resistance levels around $0.66 to $0.70.
—> Click here to Trade EOS with Bitget <—
Does the Daily Chart Back Up a Bigger Trend Change?
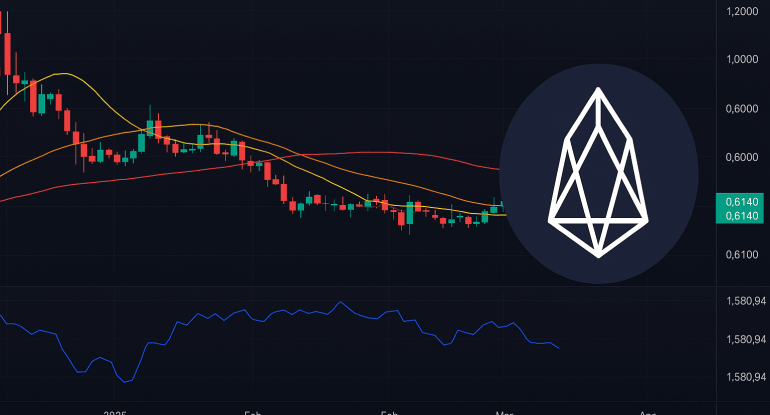
Zooming out to the daily EOS/USD chart, a bigger story unfolds. EOS price had been heading down since hitting highs around $1.40 in December 2024, but that bearish energy seems to have weakened over March 2025.
Now, the tide seems to be turning:
- EOS closed today with a nice 6.67% gain, hitting a peak of $0.646, and is currently trading around $0.614 — clearly above the 20-day SMA ($0.5481) and creeping above the 50-day SMA ($0.5727).
- This is pretty important because it’s the first time it’s broken above the 50 SMA in over two months, suggesting a possible shift in the mid-term trend.
However, there are still a couple of resistance areas looming above — the 100 SMA ($0.6792) and 200 SMA ($0.6681). The range between $0.66 and $0.68 is likely to act as a strong area of selling pressure. A break above that with good volume would likely send EOS into price discovery mode, potentially targeting $0.80 and higher.
Interestingly, the ADL (Accumulation/Distribution Line) on the daily chart is also showing a slight downward drift, though not as steep as on the hourly chart. This suggests that overall sentiment might still be a bit cautious – a classic setup for a surprise breakout if buying volume comes flooding in.
What Signals Are the Main Indicators Giving Us?
Let’s quickly break down what the key indicators are telling us across both charts:
- Heikin Ashi Candles: These smooth out the price action, making momentum changes clearer. Both charts are now showing strong green candles with very small wicks – a sign of trending momentum.
- MA Ribbon (SMA 20/50/100/200): On the hourly chart, the shorter-term MAs are moving above the longer-term ones (bullish crossover). On the daily chart, the price is trying to push above mid-term MAs, which is a key signal for a potential trend reversal.
- Accumulation/Distribution Line (ADL): It’s currently lagging behind but not contradicting the uptrend. If this starts to climb along with the price, it will confirm genuine buying pressure, rather than just short-lived speculative pumps.
—> Click here to Trade EOS with Bitget <—
So, Where Could EOS Price Go From Here?
Considering the hourly breakout and the daily chart testing resistance, EOS price might be moving from a period of building up to a phase of pushing higher. If it manages to break through the $0.66–$0.68 resistance zone, the path towards $0.75 and maybe even $0.85 could open up pretty quickly.
However, if it gets rejected at these levels, we could see a short-term pullback back to the 20-day SMA around $0.548. This would still keep the bullish outlook intact unless the price really tanks below $0.52.
EOS Price Prediction: Is This a Bull Trap or a Real Breakout for EOS?
Right now, EOS price is at a crucial point. The hourly chart suggests a short-term breakout is underway, and the daily chart is also cautiously looking bullish. We need to see volume and actual accumulation pick up to keep this rally going, but early signs are definitely pointing towards a genuine breakout attempt.
If EOS price can turn the $0.66–$0.68 zone into a support level, the case for a bullish run becomes much stronger. Until then, traders should keep a close eye on volume and think about any dips back to the $0.58–$0.60 area as potential spots to jump back in.


