
Ethereum Price Surge: What’s Behind Today’s Rise?

Ether
has been making waves, surging 7% in 24 hours to around $2,350 on March 3rd. It even briefly touched $2,550 before traders took profits. And even with some profit-taking following that peak, Ether is still up 13% from its $2,075 low last week.
ETH/USD four-hour price chart. Source: TradingView
Several factors are fueling Ether’s recovery from its recent lows, including:
-
Trump’s latest comments about a US Crypto Strategic Reserve.
-
A rise in ETH holdings among large investors, known as “whales.”
-
Positive technical indicators, highlighting strong support levels.
Trump’s Crypto Reserve Announcement Boosts Ether
The latest surge in Ether’s price is largely seen as a response to Trump’s recent announcement regarding a US Crypto Strategic Reserve.
Key points from the announcement include:
-
Trump’s directive to the President’s Working Group on Digital Assets includes adding XRP
, Solana , and Cardano
to the crypto strategic reserve.
-
Crucially, Trump specified that Bitcoin
and Ether would form the “heart of the reserve.”
-
This inclusion signals potential regulatory clarity and could pave the way for wider institutional adoption of ETH.
-
Market analysts interpret this move as a positive sign for Ethereum’s future role in the financial system.
-
Crypto analyst Poseidon, for instance, is predicting a rally to $4,000 by April.

Source: Poseidon’s X Post Thread
Ethereum whales are waking up
Adding to the positive momentum, Ether’s recent gains also coincide with a consistent increase in the ETH supply held by whales.
Here’s what’s noteworthy:
-
Another factor contributing to Ether’s rise is increased activity from large investors. Data from Glassnode reveals that so-called ‘whales’ holding between 1,000 to 10,000 ETH have been consistently accumulating more Ether since January.
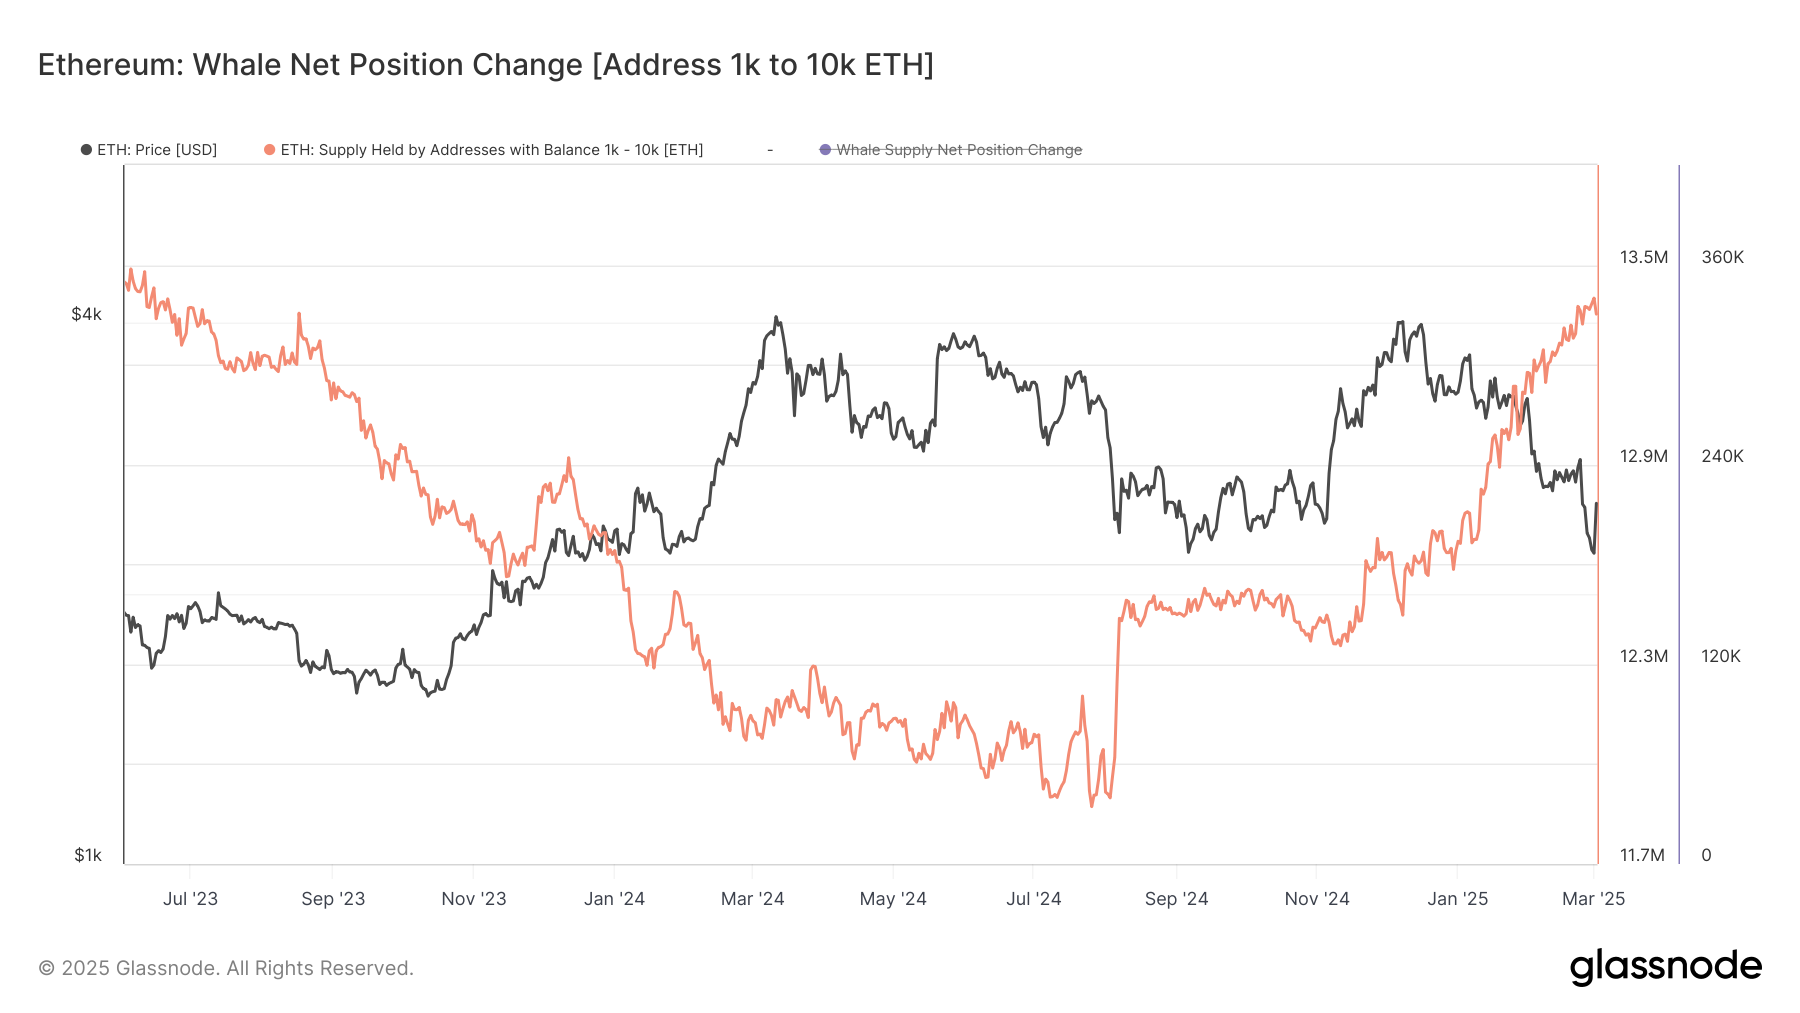
Ethereum whale net position change (1k-10k ETH). Source: Glassnode
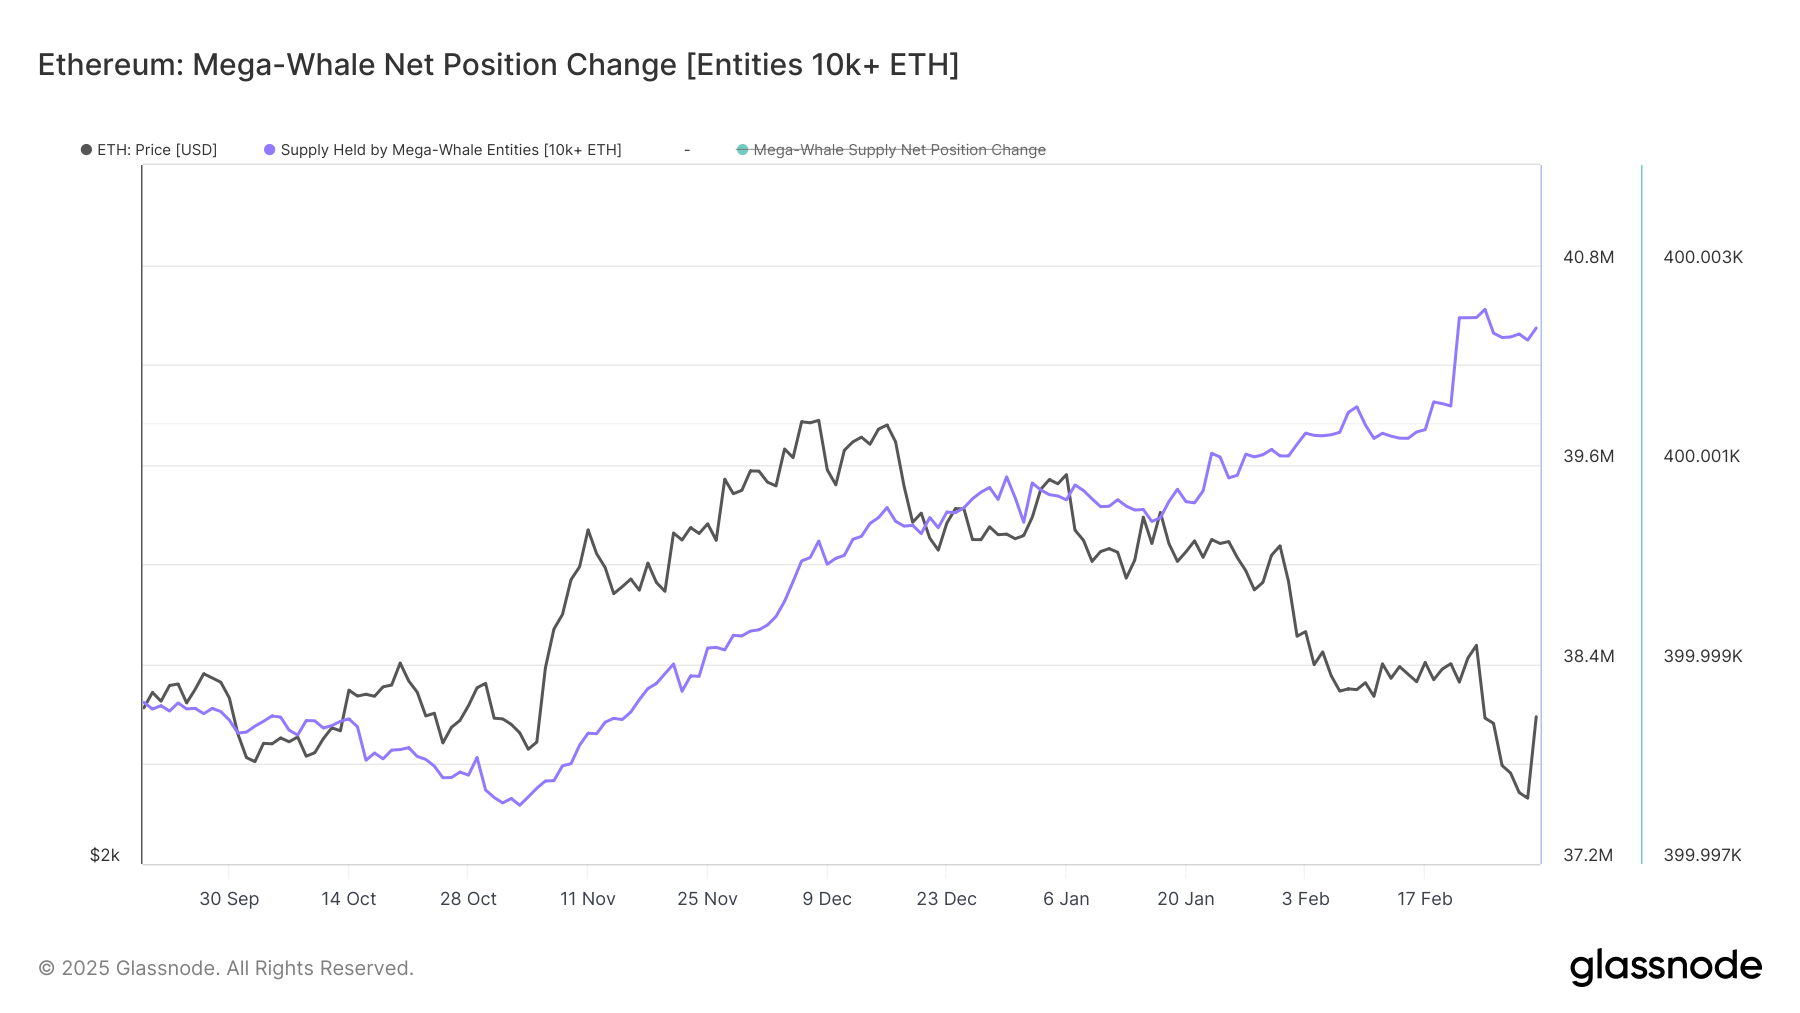
Ethereum mega-whale net position change (10k+ ETH). Source: Glassnode
Related: Ethereum’s Pectra upgrade could lay groundwork for next market rally
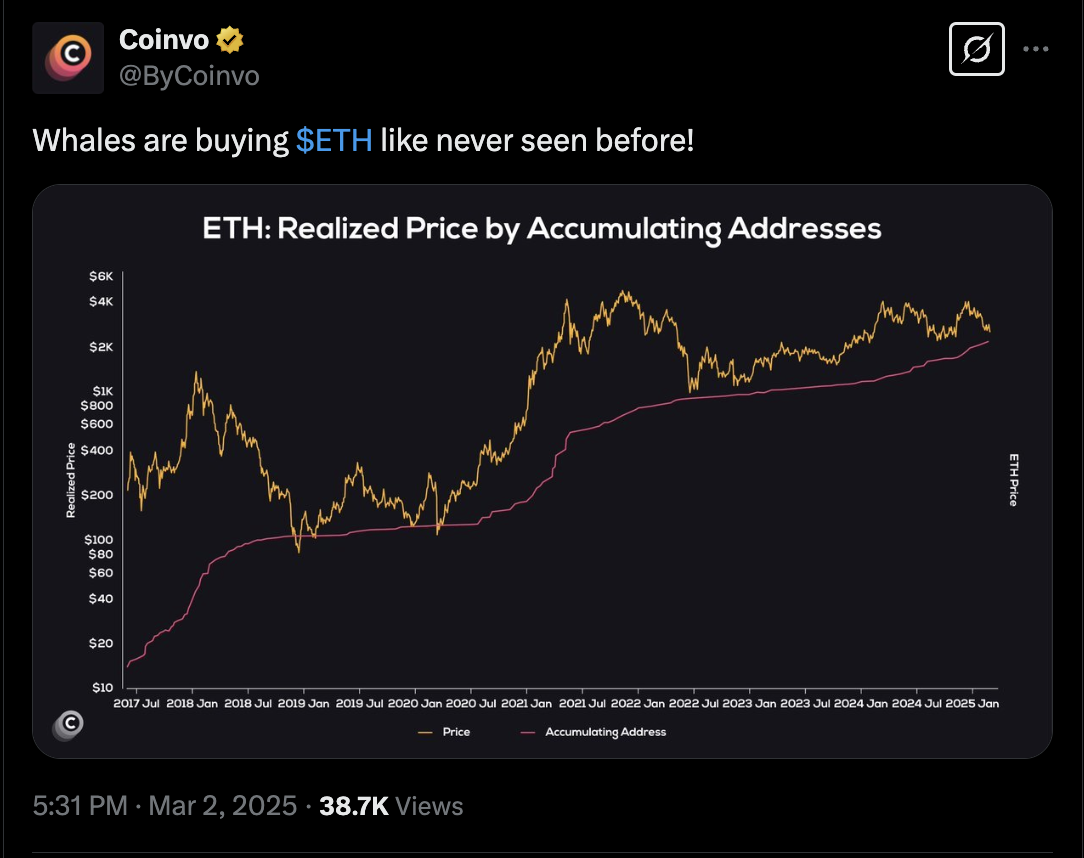
Source: Coinvo
ETH price bounces from multimonth support
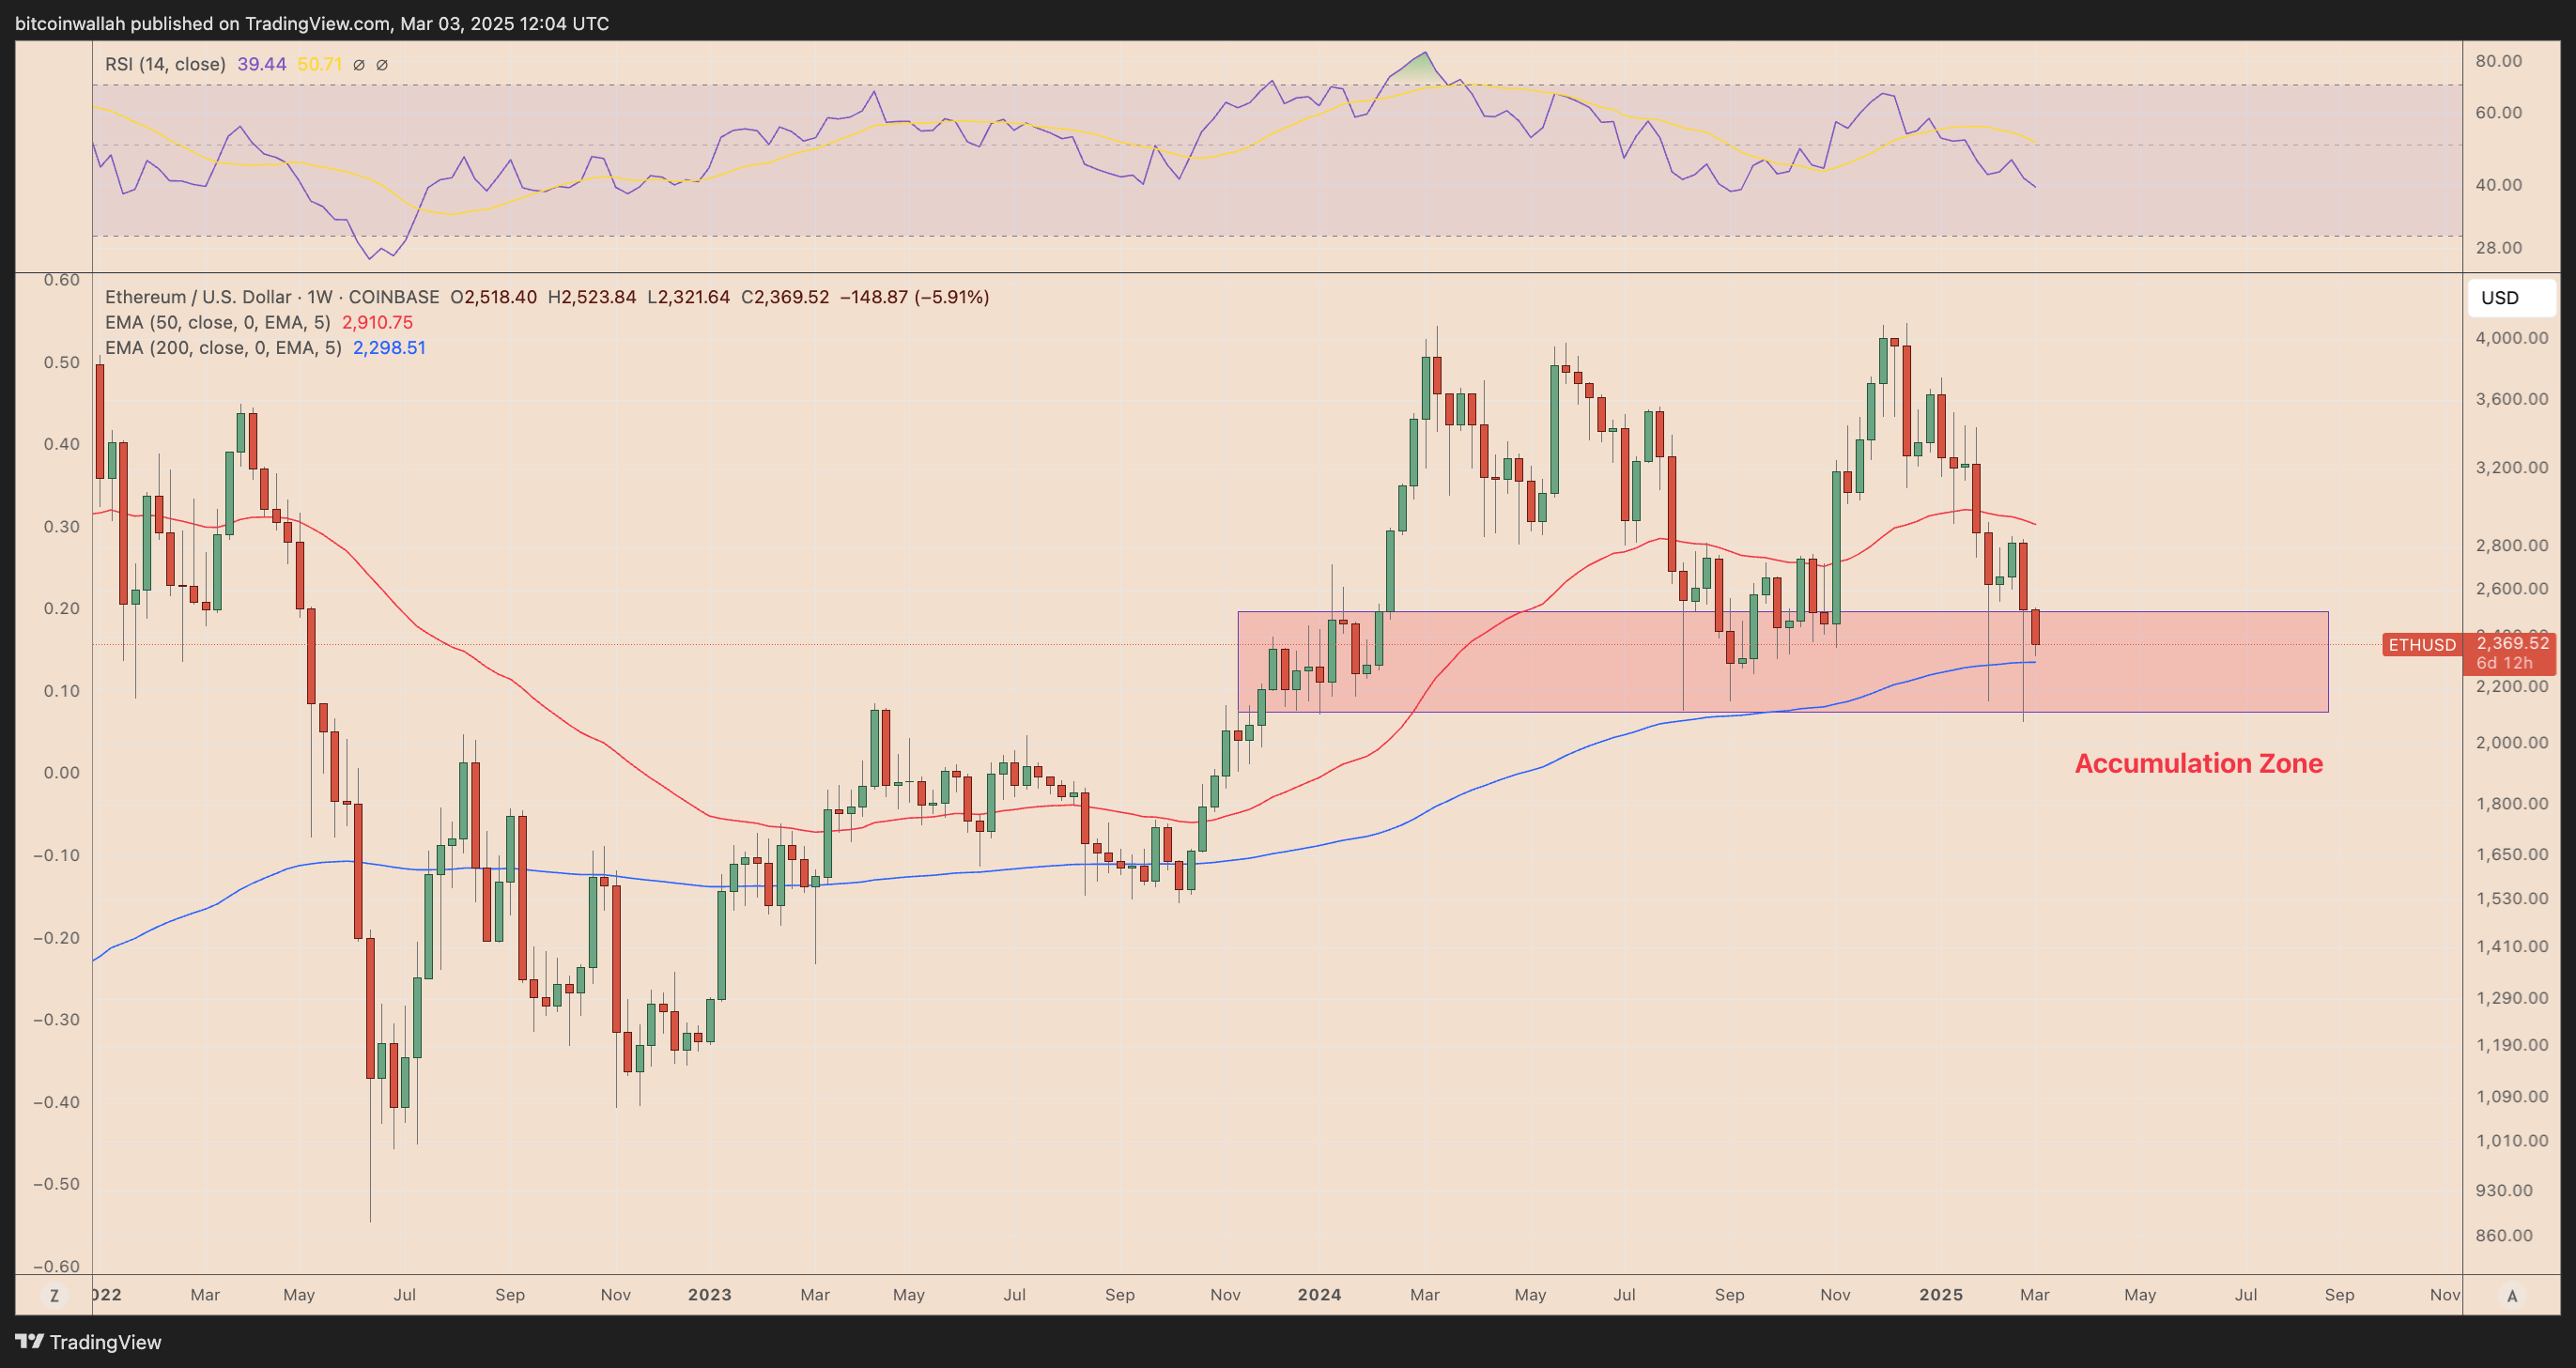
Looking at the charts, Ether’s current price surge seems to come after a test of a long-term accumulation zone (highlighted in red). This zone has historically acted as a springboard for short-term price gains.
ETH/USD daily price chart. Source: TradingView
Here are the key technical observations:
-
Since December 2023, sellers (‘bears’) have repeatedly tried, but failed, to push Ether’s price below the $2,100-$2,500 range.
-
This price range is reinforced by a significant support level: the 200-week exponential moving average (EMA), represented by the blue line, currently around $2,300.
-
As of March 3rd, Ether is showing signs of a rebound, bouncing off the 200-week EMA support and now aiming for a further rally towards the 50-week EMA, around $2,910.
-
If Ether can successfully break through the 50-week EMA, the next target could be the upper resistance of its current sideways trading pattern (‘rectangle pattern’), sitting around $4,000.
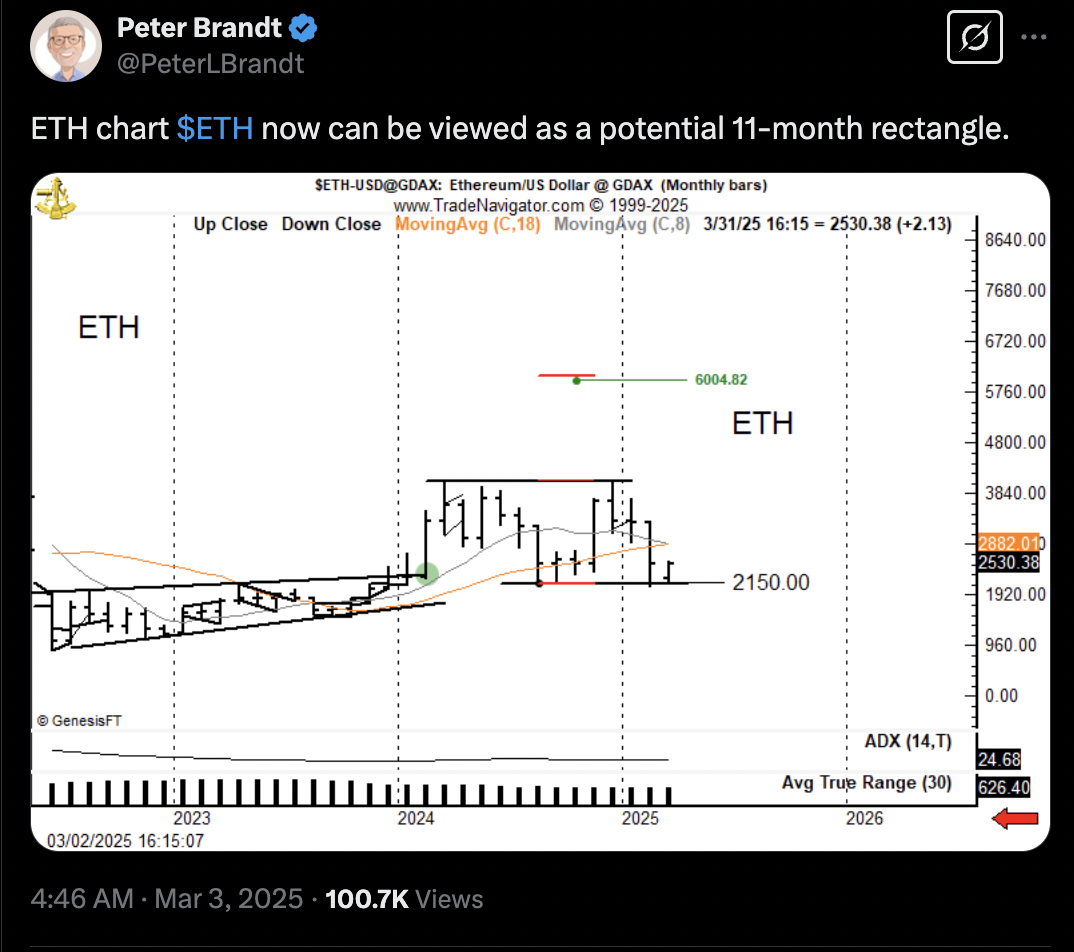
Source: Peter Brandt
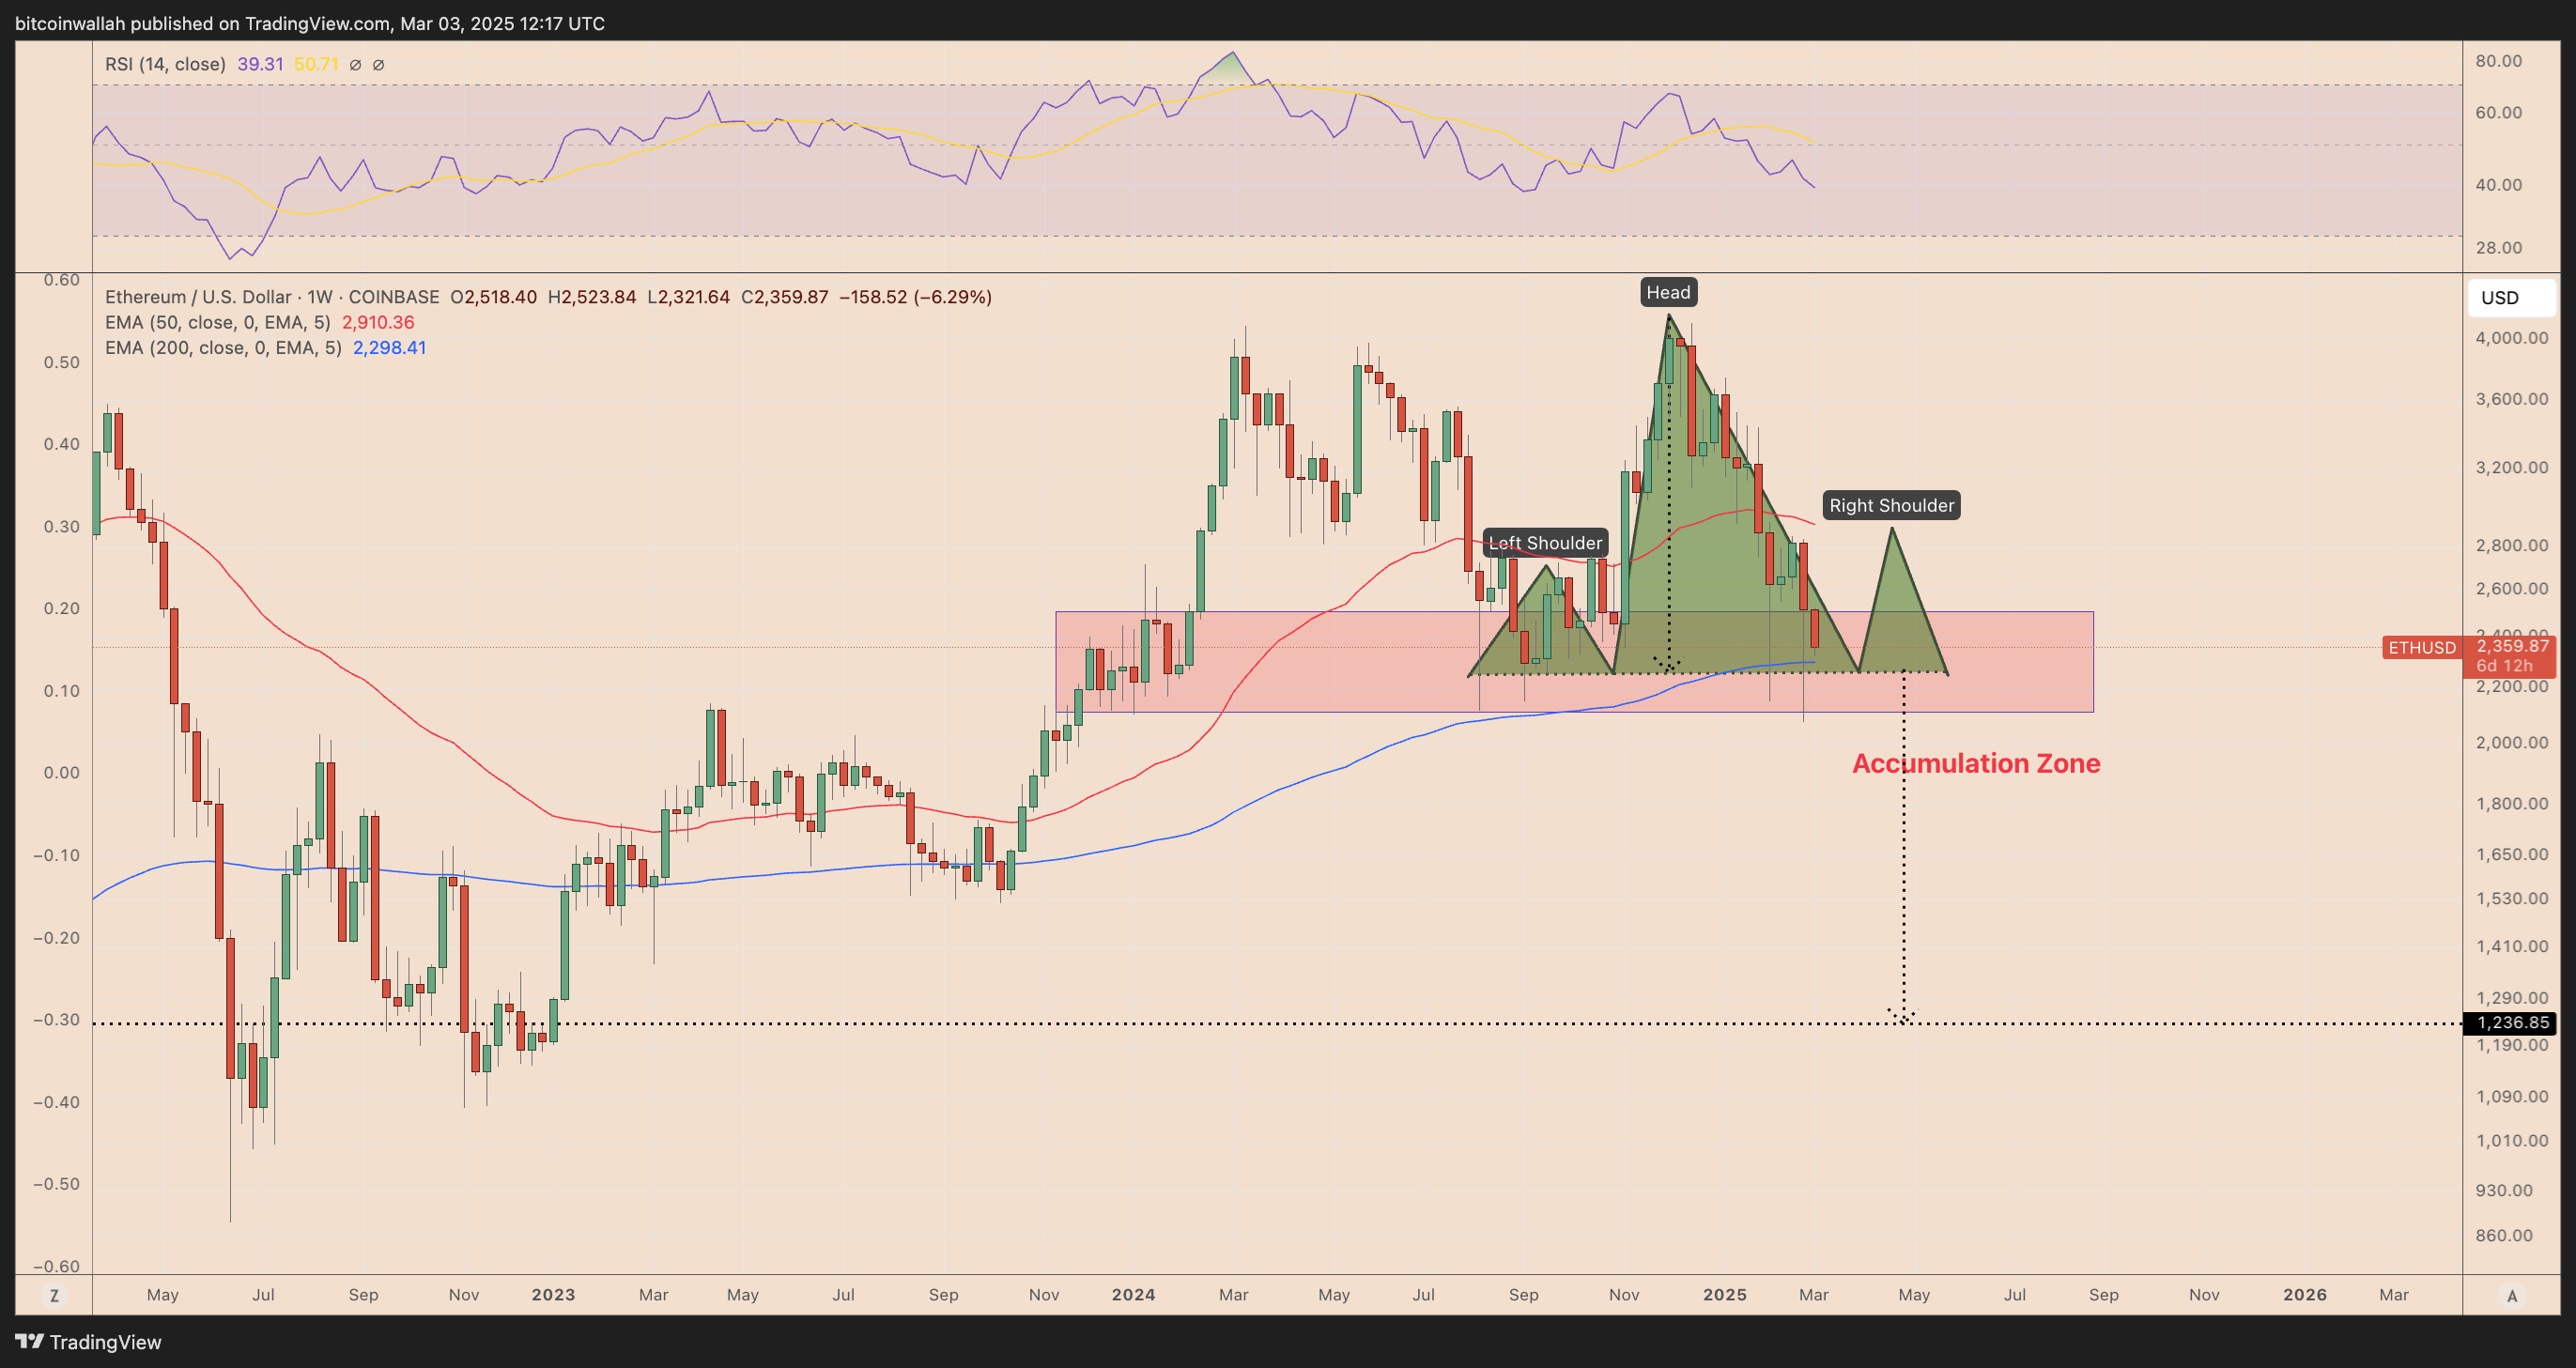
ETH/USD weekly price chart. Source: TradingView
-
The ‘Head and Shoulders’ (H&S) pattern is a bearish formation. It typically plays out when the price breaks below the neckline support, leading to a potential drop equal to the pattern’s height.
-
Should the current recovery falter, and the H&S pattern activate, technical analysis points to a potential downside target of $1,360 for Ethereum.
This article does not contain investment advice or recommendations. Every investment and trading move involves risk, and readers should conduct their own research when making a decision.


