
SOL Price Forecast: 89% ETF Approval – $160 Target or $120 Support
Solana is definitely grabbing more attention lately, fueled by growing optimism around its token. A big reason people are talking Solana ETF is that it seems to be leading the pack among pending ETF applications, right alongside XRP. Plus, Solana’s chain has been seriously bustling, outperforming other platforms in DEX activity and trading volume, which suggests more and more people are choosing it over the competition. Even with all this good news and the recent bounce back in SOL’s price, there’s still a worry: some indicators suggest we might see a pullback down to around $125.
Drop in the Solana Market Data
To really get a feel for where prices might be going, we’ve got to look at the future markets. These markets are where traders make their predictions on what’s going to happen. Right now, something interesting is happening with Open Interest (OI), which is basically the total number of open contracts that haven’t been closed yet – it’s dropped quite a bit. And along with that, trading volume has also been steadily decreasing.
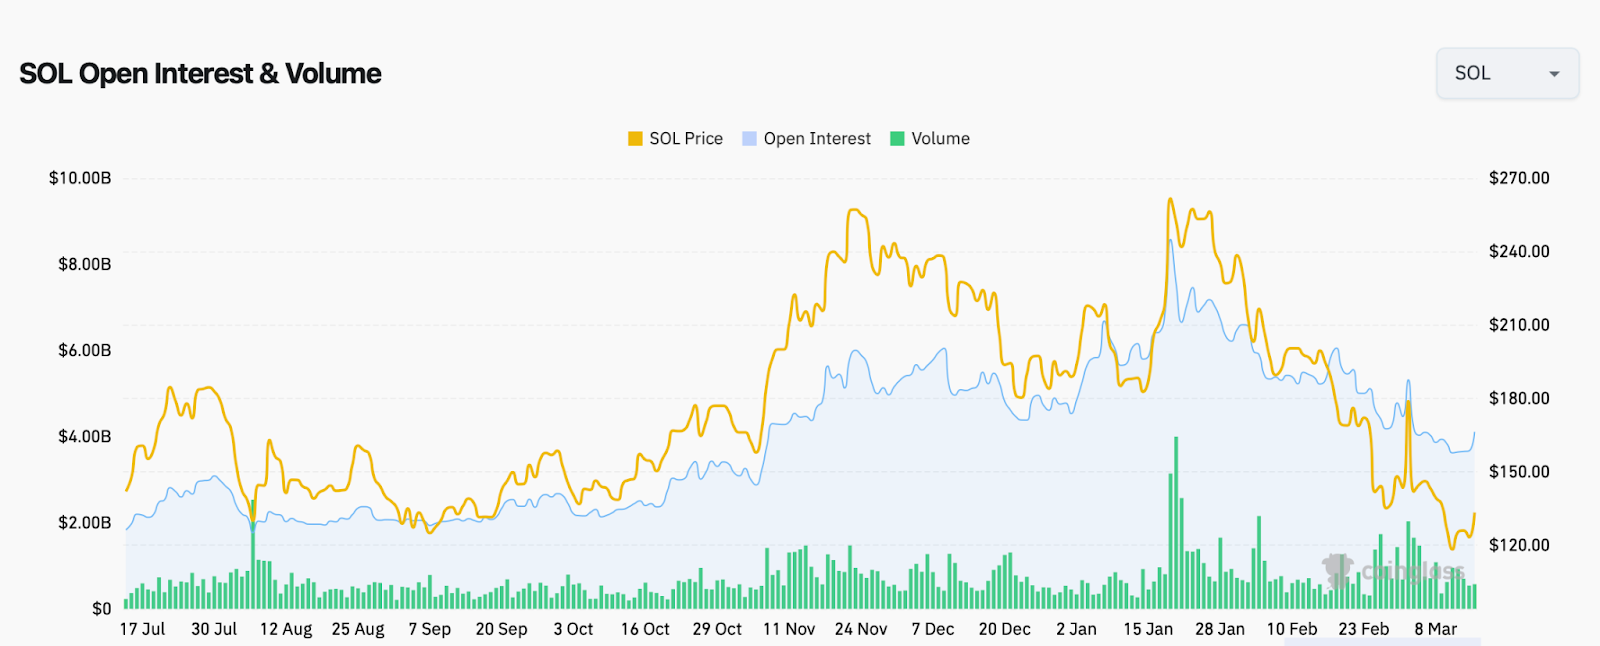
This dip in OI and volume can tell us something – it indicates that spot traders might also be feeling uncertain about where Solana’s price is headed. With less activity in the market, volatility has also calmed down, and the price seems to be stuck in a pretty tight range. Interestingly, it looks like traders are leaning towards a more bearish outlook on Solana, as short trades have been piling up quite significantly.
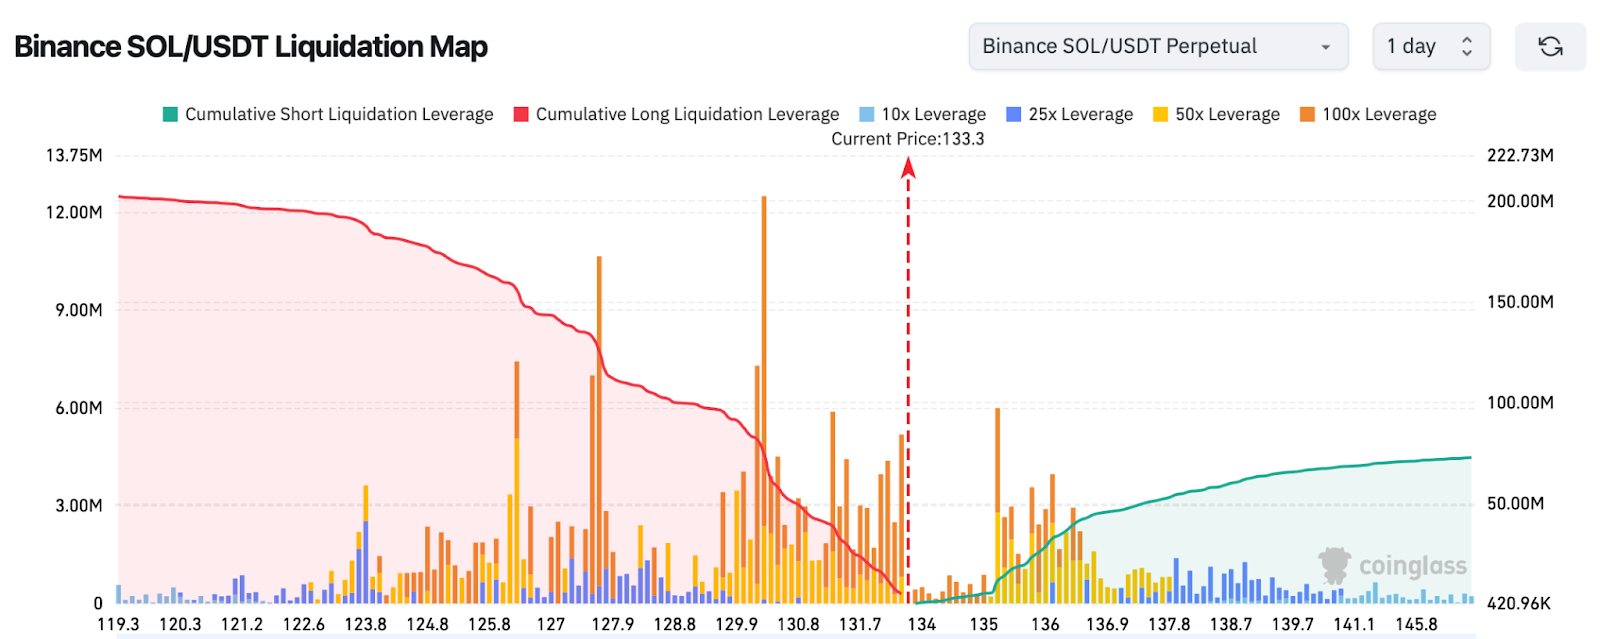
Looking at the chart above, you can see a pretty clear jump in short trades compared to long trades. This really suggests that those trading futures think Solana’s price might take a dip in the near future, possibly down to around $130, and maybe even further to $128. Even after climbing above $135, it seems like the overall sentiment has become more cautious. This could mean we’ll see the price continue to fluctuate in a relatively narrow band between $130 and $136 for a bit.
Is Solana (SOL) Price Heading Back to $125?
If we zoom out to the weekly chart for Solana, things look a bit concerning from a bearish perspective. The price actually dipped below what looked like a rising channel and hasn’t managed to get back above it. While we have seen some buying activity and bulls trying to step in a few times, the price has largely stayed within a range. However, the technical indicators are hinting that we might be in for some bearish price movement soon.
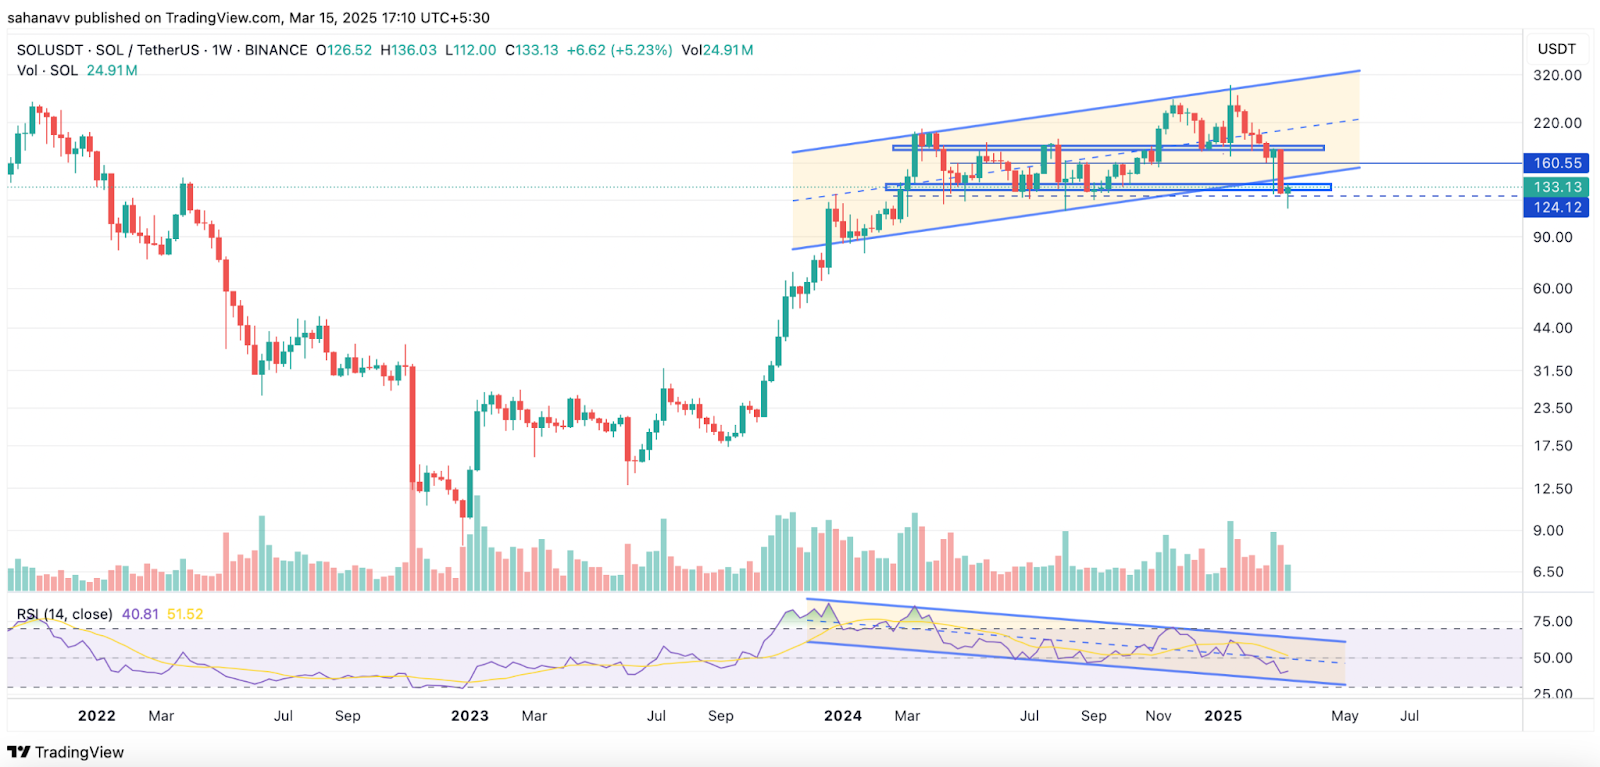
Looking closer at Solana’s weekly price chart, we can see a potentially worrying trend: even though the price is trying to inch upwards, the Weekly RSI (Relative Strength Index) is actually trending downwards. This divergence is a signal that a pullback could be on the horizon and might happen pretty quickly. While the price briefly fell below the channel’s support level, the real test will be whether Solana can climb back above it before the weekend is over. If it can’t reclaim those levels, then there’s a real fear that Solana’s price might indeed slide back down to the $125 mark.