
Solana Double-Digit Price Drop Incoming? Key Levels to Watch

Reason to trust
We have a strict editorial policy, so you can count on us for accurate, relevant, and unbiased reporting.
Our content is created by experienced industry professionals and carefully checked for accuracy.
We are committed to the highest standards when it comes to bringing you news and information.
Strict editorial policy that focuses on accuracy, relevance, and impartiality
Morbi pretium leo et nisl aliquam mollis. Quisque arcu lorem, ultricies quis pellentesque nec, ullamcorper eu odio.
Este artículo también está disponible en español.
Crypto analyst SiDec is making waves with a prediction: the Solana price could potentially tumble down to double digits. As the market braces for a possible significant downturn, SiDec has pinpointed key levels that traders should be watching for potential entry points.
Major Levels To Watch As Solana Price Risks Drop To Double Digits
In a recent analysis shared on TradingView, SiDec identified the $136 to $143 range as a significant resistance area for Solana. Looking downwards, he highlighted the $102 to $98 zone as the next critical support level. This suggests that if Solana fails to maintain this support, we could see it testing double-digit prices soon.
Related Reading
SiDec pointed out that Solana’s price has been gradually trending upwards over the last five days since it bottomed out at $112. However, he believes the current price movements resemble an ABC corrective pattern, hinting at a potential setup for further price decreases. When it comes to finding good entry points, SiDec advises keeping an eye on these key levels. He notes that strategically placing orders at these points can improve your chances of capitalizing on market moves without jumping in too early and risking overexposure.
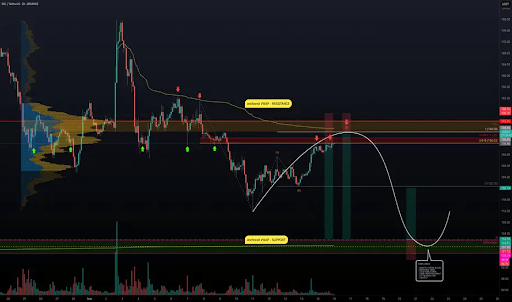
Digging deeper into the $136-$143 resistance zone, the crypto analyst suggests that the Solana price is likely to face headwinds within this range. This is because this area is packed with technical indicators that point towards a possible price reversal or a strong market reaction. Therefore, SiDec proposes that this zone is an interesting area to think about opening short positions, particularly if there are signs of price weakness.
Looking at the downside, SiDec pointed out a significant demand zone forming between $102.1 and $98.50 for Solana. He explains that this zone is reinforced by multiple technical factors, making it a strong potential area for long entries. The analyst suggests that this zone offers a compelling opportunity to gradually build long positions as the price dips further into the support area.
Market Outlook For SOL
SiDec’s current market view leans bearish in the short-term, until Solana can reclaim the $143.80 level. This level is seen as a robust resistance point for potential short trades. For traders considering short positions, SiDec recommends scaling into the resistance zone. This approach helps in better managing risk and achieving more effective entry prices.
Related Reading
Conversely, for those looking at long positions, SiDec suggests starting with smaller positions around $112 and gradually increasing the size as the price moves down to $98.50. He argues that this strategy ensures a solid position within a high-probability demand zone. According to SiDec, scaling into trades offers more flexibility compared to committing at a single price point, improving trade execution and helping traders adapt more effectively to fluctuating market conditions.
Adding further insight into Solana’s price behavior, SiDec highlights that the $100 target level aligns with the 200 Exponential Moving Average (EMA) on the weekly chart, strengthening the significance of this support level.
The analyst further notes that if Solana’s price decisively breaks above $144, it would negate the bearish outlook and could signal a potential upward move towards $150. On the flip side, a significant rejection from the resistance zone could accelerate a move downwards towards $112 to test the demand at the swing low.
As of now, the Solana price is hovering around $128, having decreased by over 4% in the last 24 hours, according to data from CoinMarketCap.

Featured image from iStock, chart from Tradingview.com


