Stellar to $2: Is it Possible in 15 Days?

Stellar (XLM) has been pretty quiet lately, especially after that strong showing it put on at the end of 2024. Traders are now scratching their heads, wondering if this chill period is just the calm before another bullish storm—or if it’s simply a sign of things settling down for a while. Currently trading around $0.268, XLM is kind of hanging out below some important moving averages, which naturally makes people ask: Is there any real chance XLM price could skyrocket to $2 in just the next couple of weeks? Let’s dig into the daily chart and see what we can figure out.
Stellar Price Prediction: Is XLM Gearing Up for a Breakout or Breakdown?
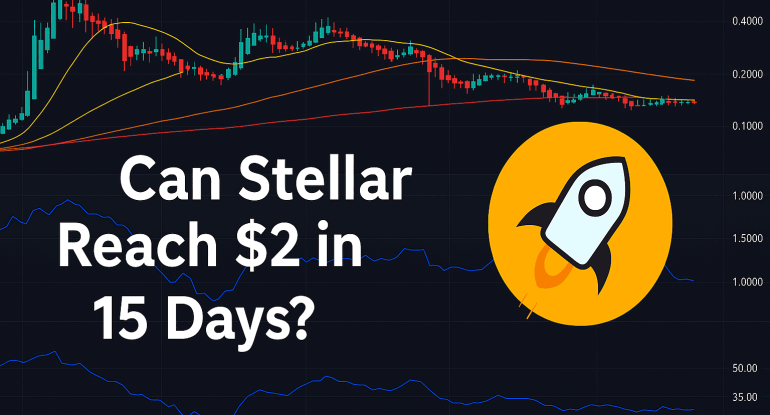
If you take a look at the chart, you can see Stellar has been in a bit of a slow, steady downtrend since its big rally in December 2024. Remember when it briefly touched almost $0.60? Yeah, things have definitely calmed down since then. We’re using Heikin Ashi candles here, which are great for smoothing out the price action and making trends clearer. And right now, those candles are mostly small and not very exciting – that’s usually a sign of indecision in the market and not a lot of volatility.
One thing that really stands out is how the price action is squeezed below the 20-day, 50-day, and 100-day simple moving averages (SMA). However, the 200-day SMA is sitting below the current price, acting like a longer-term safety net around ~$0.28, which XLM is kind of dancing around right now. This is basically a tug-of-war between some short-term negative pressure and some longer-term support underneath. But, the fact that XLM can’t even seem to push above the 20-SMA at ~$0.275 really highlights that buyers aren’t exactly rushing in at the moment.
What Do the Indicators Say?
Let’s take a peek at a couple of key technical tools on this chart:
- MA Ribbon (20, 50, 100, 200 SMA): The moving average ribbon is definitely stacked in a bearish way – with the shorter-term SMAs below the longer-term ones. This confirms we’re in a bearish phase for now. Price is jammed under all the main short-term MAs, meaning there’s a good bit of resistance overhead. For things to turn bullish, XLM would first need to get back above $0.28, and then really punch through that $0.30–$0.35 area to start looking bullish again.
- Accumulation/Distribution Line (ADL): The ADL is currently at 1588.39, and it’s got a slight downward tilt—which tells us that selling pressure (distribution) is still a bit stronger than buying (accumulation). We haven’t seen a big jump in volume either, the kind that usually comes before a bullish breakout, suggesting the “smart money” isn’t jumping in just yet.
Put it all together, and the indicators are painting a picture of an asset that’s just bouncing around in a range, waiting for something to happen. Bulls and bears are pretty evenly matched right now—but that balance can shift quickly with a bit of news or if Bitcoin decides to make a move.
Is $2 Realistic in 15 Days?
Okay, let’s be real for a second: going from $0.268 to $2 would be a massive 645% jump in just two weeks. That’s super extreme and honestly, pretty unlikely unless we see some huge, game-changing news, like:
- A major announcement about Stellar being adopted by some big player
- Integration into a worldwide payment system
- A crazy altcoin season where everything goes parabolic, led by Bitcoin.
Historically, Stellar has been known to make some crazy vertical moves when things get really speculative, but we’re just not in that kind of market right now. For XLM price to even think about hitting $2, it would have to smash through a bunch of resistance levels, including $0.30, $0.40, $0.60, $1.00, and $1.50, one after the other—without getting pushed back down. That’s a really, really tall order when the indicators are showing low volume, the moving averages are lined up bearishly, and there’s not much sign of buying pressure.
What Price Levels Should You Watch?
If you’re trading or investing in XLM, here are the key levels you should keep an eye on:
- Support: $0.26 (really important short-term support), $0.24 (the low from January), $0.20 (kind of a base level psychologically)
- Resistance: $0.275 (the 20-SMA), $0.30 (major resistance), $0.35 (level to watch for trend reversal confirmation)
A bullish scenario would be if XLM can cleanly break above $0.30 with some good volume behind it, and then manage to hold it as support when it comes back to test it. On the flip side, a bearish scenario would be if XLM loses that $0.26 level and heads back down towards $0.24 or even lower.
Stellar Price Prediction: Moonshot or Mirage?
While crypto is famous for being unpredictable, the technicals right now just don’t suggest that a $2 price target for Stellar in 15 days is very likely—at least not without some crazy, unexpected event to set things off. The trend right now is more sideways to slightly down, with those moving average resistances holding the price down and not much strong buying activity happening.
However, if the overall market mood improves and XLM price can actually break above $0.35 with some volume, then a short-term rally up towards $0.50–$0.60 isn’t out of the question. Until then, traders should probably play it safe and wait for some clear breakout signals before betting on a moonshot.


