
Stellar [XLM]: Bearish Price Forecast

- Good news for XLM bulls – they’re trying to turn the $0.3 mark back into a support level.
- On the 4-hour chart, the RSI and OBV indicators are hinting at potential bullish momentum.
Stellar (XLM) has been on a downward trend, but here’s an interesting detail: trading volume has been unusually low lately. This suggests the bearish mood might not be solely about XLM, but rather a reflection of broader market jitters and Bitcoin’s (BTC) recent struggles.
Actually, if you look at the shorter-term charts, XLM appears to be at a crucial turning point. Buyers are stepping up, pushing against that $0.3 resistance. So, the big question is: can they break through and kickstart an upward move?
Stellar in a Short-Term Range, Facing Resistance up to $0.31
Source: XLM/USDT on TradingView
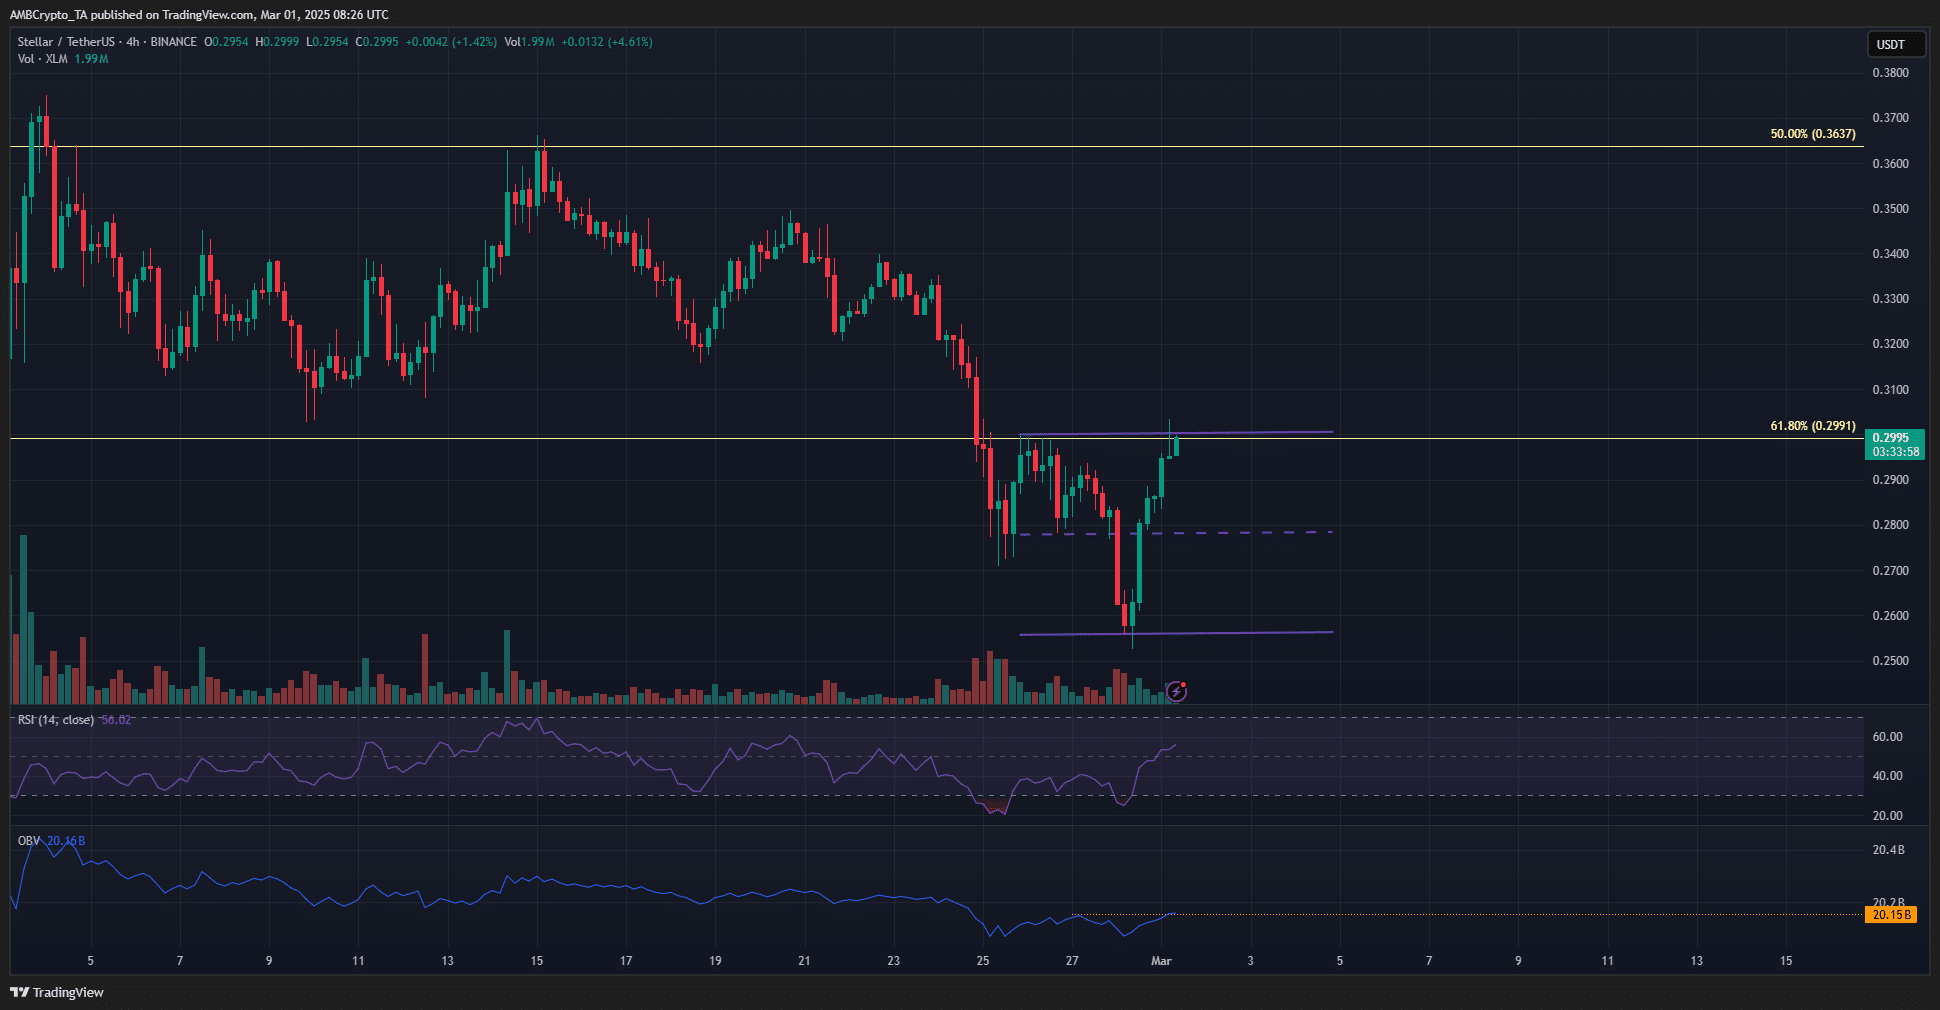
That 61.8% Fibonacci retracement level? It’s now acting as resistance after previously being support. Currently, XLM has bounced back by 19% in just a day and is testing resistance around $0.299. But, will this bullish attempt get turned away again?
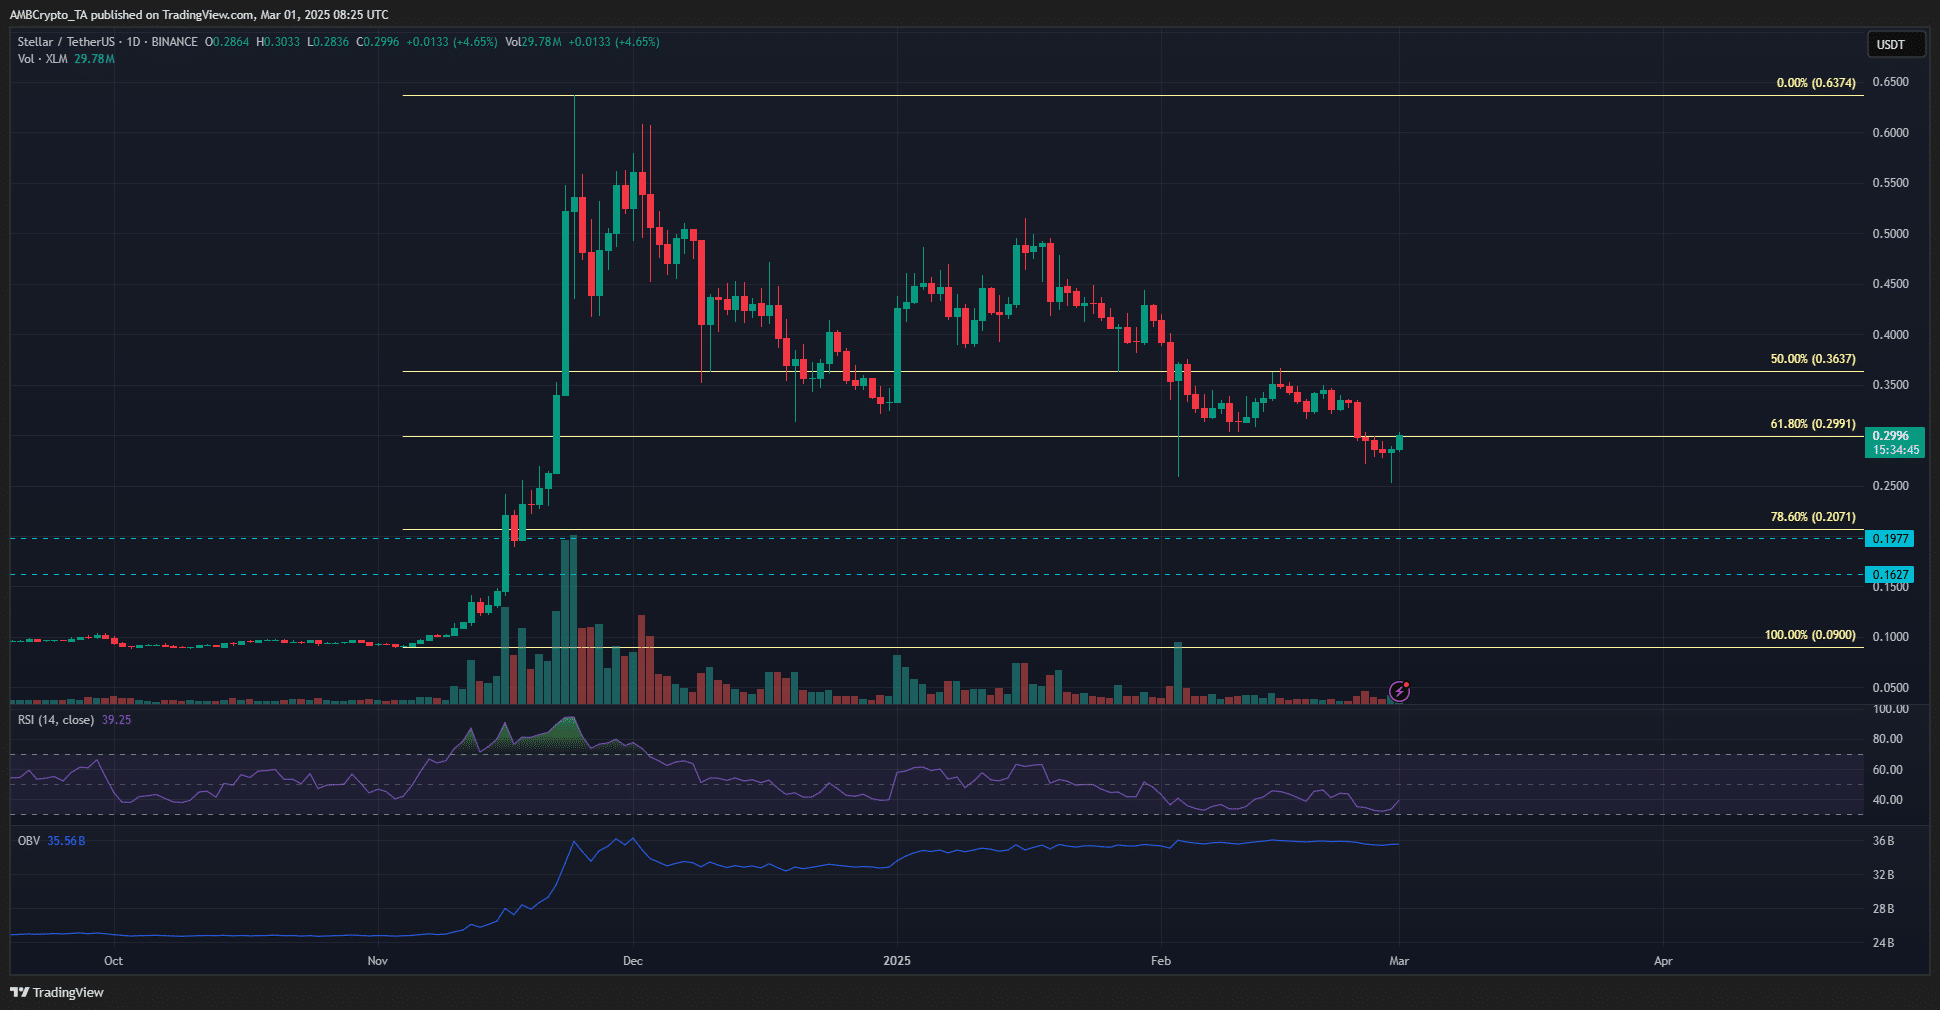
Looking at the daily chart, the overall market trend for XLM has been bearish throughout February. Until that trend shifts, it might not be wise for swing traders to anticipate a full bullish reversal. These upward price movements, like the current one, could actually be seen as chances to sell.
Right now, the daily RSI is still below 40, indicating considerable bearish momentum. However, the On Balance Volume (OBV) isn’t showing a downward trend. This is interesting because it suggests selling volume hasn’t been massive, even with February’s price drops. And this gives a glimmer of hope—a quick recovery could be on the cards if Bitcoin manages to bounce back.
Source: XLM/USDT on TradingView
Switching to the 4-hour chart, we can see XLM trading within a range between $0.256 and $0.3. Adding to the resistance, there’s a fair value gap just above, in the $0.303-$0.31 area, which could further hinder any bullish advances. So, despite the RSI climbing above 50 and the OBV hitting a recent high, traders should still be prepared for a potential downward move.
Now, if XLM manages to flip $0.3 back to support and then push past $0.31, this bearish outlook would be invalidated. On the flip side, if the price gets rejected in that $0.3-$0.31 zone, it could be a signal to consider shorting XLM, with targets around $0.273 and $0.256.
Source: Coinglass
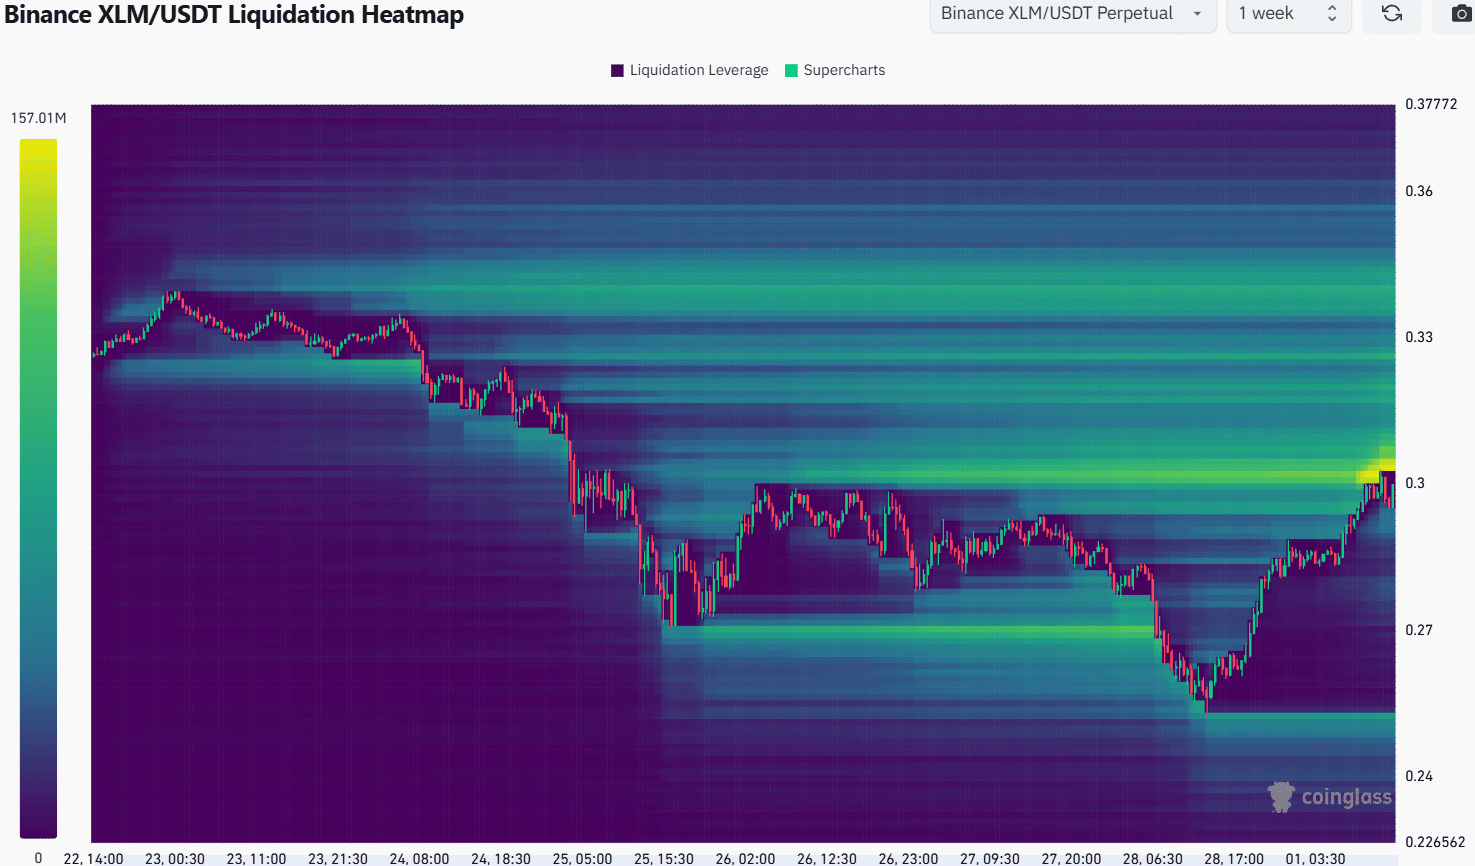
Looking at the liquidation heatmap from the past week, there’s a clear ‘magnetic’ area just above the current price. The $0.303-$0.31 range is packed with liquidation orders, which could be tested before any significant bearish reversal. Even so, traders should tread carefully.
Zooming out to the 1-month liquidation heatmap, we see sizable liquidation zones also at $0.35 and $0.37. These levels could potentially draw XLM’s price upwards. So, if buyers do manage to turn $0.3 into support, traders might need to reconsider their bearish stance and prepare for potential further upward movement.


