
TRUMP Memecoin: $5 Target in Sight?

- Signs of a bearish trend for Official Trump have been showing across different timeframes, suggesting sellers are in control.
- While the $9 mark held strong in early April, it has now broken, opening the door for TRUMP to potentially slide down to $4.47.
Official Trump [TRUMP] just can’t seem to catch a break, continuing its relentless slide downwards on the charts. Adding fuel to the fire, Monday’s market-wide panic sent Bitcoin [BTC] tumbling to $74.5k, and TRUMP felt the pressure, plummeting 15% in just 24 hours.
Interestingly, despite the price drop, its 24-hour trading volume has exploded, nearly quadrupling.
This surge in trading activity, coupled with the rapid price decline, strongly suggests a dominant bearish sentiment in the market. For those holding TRUMP, it might be wise to watch for a small price rebound as a potential opportunity to sell.
TRUMP Plunges Below $9 – Is $5 Now in Sight?
Source: TRUMP/USDT on TradingView
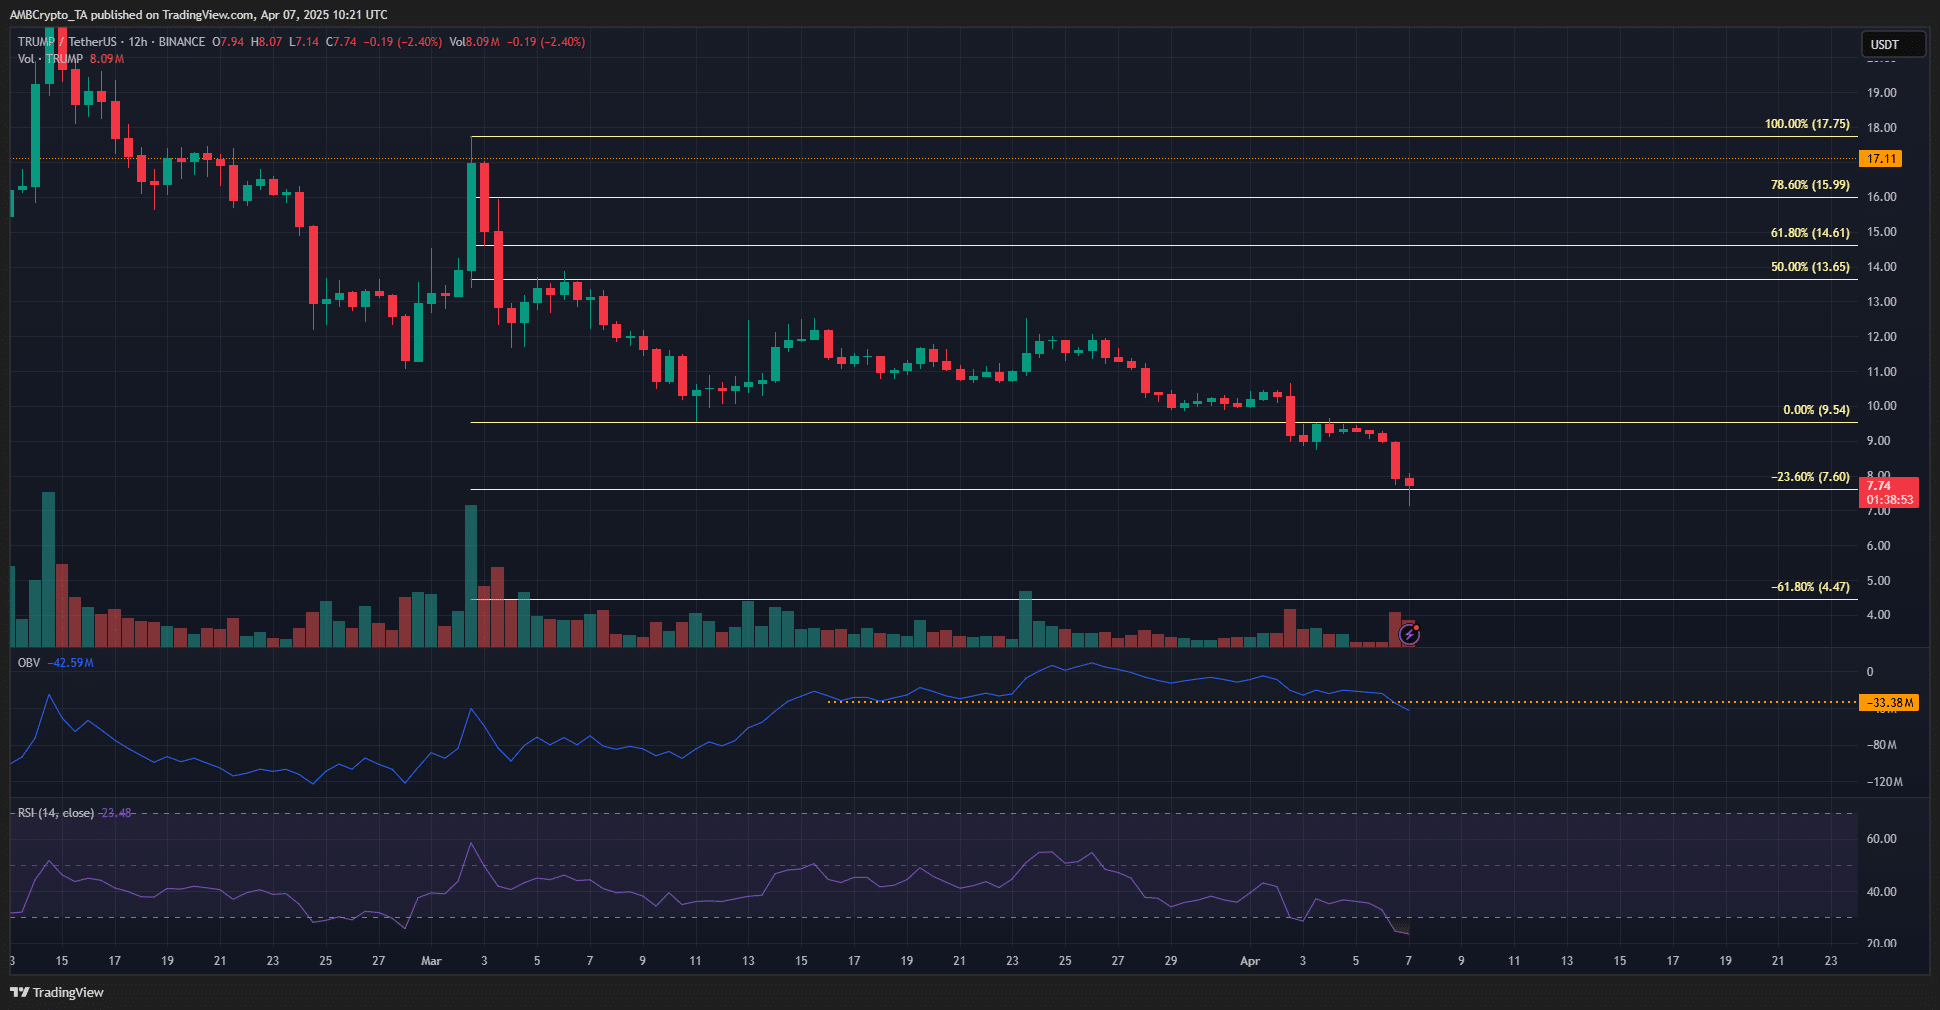
Looking at the 12-hour chart, the bearish picture becomes clear. This negative trend isn’t just on this timeframe; it’s consistent all the way from the daily down to the hourly charts. This overall bearish structure has been in play for the last three months. While the continued downtrend isn’t exactly surprising, the On Balance Volume (OBV) breaking below a key support level is definitely something to take note of.
Going back to March 15th, we can see that the OBV had been holding above a certain level (marked with an orange dotted line), gradually climbing upwards as March progressed. This suggested growing buying interest, even if it wasn’t quite the frenzy seen back in February. It seemed like the buyers were gaining ground.
However, things took a sharp turn in April. The OBV started dropping towards that support level and, recently, has plummeted even further. This indicates that any buying activity or accumulation from the past three weeks has been completely overshadowed by selling pressure. Adding to the bearish signals, the Relative Strength Index (RSI) is down at 23, deep in oversold territory – a clear sign of strong downward momentum.
Despite all this negativity, there’s a chance that TRUMP bulls might try to defend the $7.6 level as a support zone. This price point lines up with the 23.6% Fibonacci extension and could potentially trigger a small bounce back up.
Source: TRUMP/USDT on TradingView
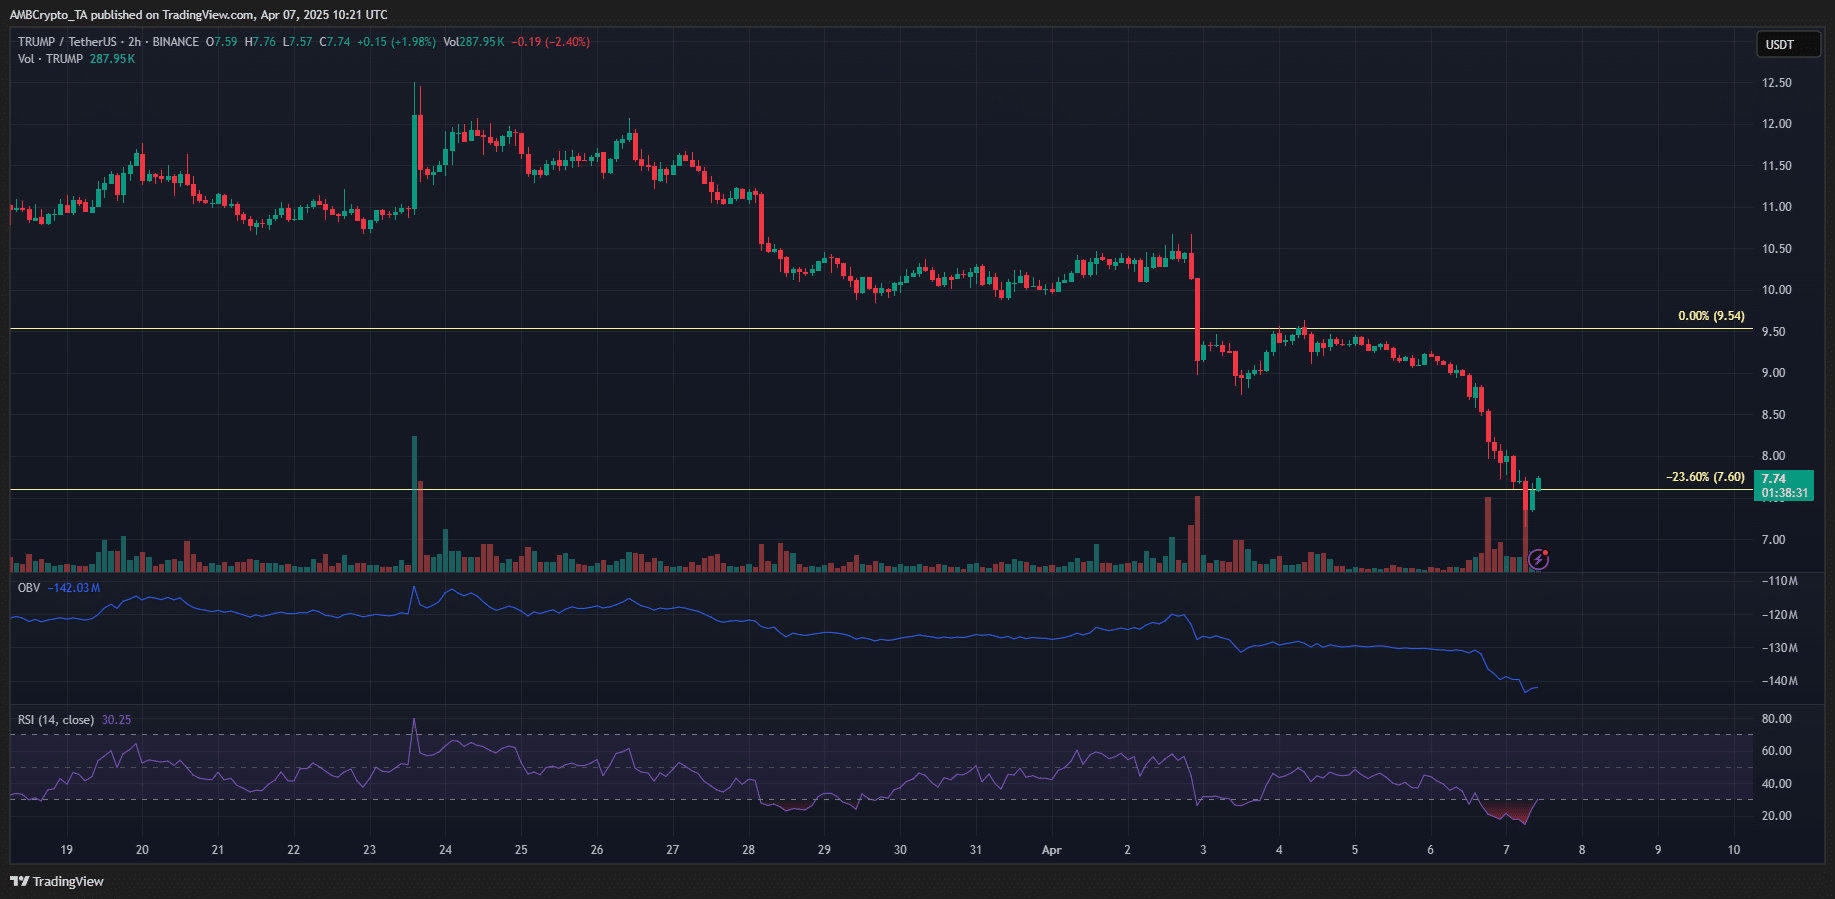
Zooming in to the 2-hour chart, the bearish signals are still flashing brightly. The OBV is still trending downwards, although the RSI is starting to creep its way out of oversold territory. We might see a short-term price bounce, potentially reaching back up to the $9 level, which previously acted as a support.
However, if the price does revisit that $9 area, it’s likely to face renewed selling pressure and continue its downward trajectory. Looking at the bigger picture on the 12-hour chart, the 61.8% Fibonacci extension level around $4.47 is still looming as the next significant target to watch.
Disclaimer: Please remember, this analysis is for informational purposes only and should not be taken as financial, investment, or trading advice. It’s purely the writer’s personal opinion.


