
XRP potential Forecast: Analyst Reveals Key Patterns

XRP potential Forecast: Analyst Reveals Key Patterns
- Analyst sees XRP potential: Could it really hit $9.7 to $27?
- Big XRP surge of 718% during the 2017-2018 bull run is a key point of reference.
- This prediction is built on technical analysis and past price trends, but remember, it’s not a crystal ball!
Crypto markets are buzzing with talk of XRP potentially skyrocketing, and one analyst, known as EGRAG CRYPTO, is making waves with a bold prediction. According to EGRAG, XRP could reach a staggering $27 this bull run! This isn’t just wishful thinking; it’s based on looking back at how XRP has performed in the past.
So, what’s the price range we’re talking about here? Well, this technical deep dive suggests we could see XRP fluctuate between a solid $9.7 and that exciting $27 mark per coin over the coming month.
XRP Price Prediction: Aiming High
Now, $27 for XRP? That’s a serious leap! But EGRAG CRYPTO’s analysis reminds us that crypto is a world of cycles, and sometimes, all it takes is a powerful narrative to kick off a price rally. Think back to the last cycle: remember when Elon Musk and Tesla jumped into Bitcoin? That kind of news can really move markets, even if other companies don’t immediately follow suit.
However, like all stories, these market narratives don’t last forever. Understanding that crypto markets go through these ups and downs is crucial. The thinking here is that while hype can give prices a temporary boost, it’s the bigger market cycles that really drive where things go in the long run.
To illustrate their point, EGRAG CRYPTO shared an XRP chart highlighting a couple of important price targets, starting with the triangle’s midpoint.
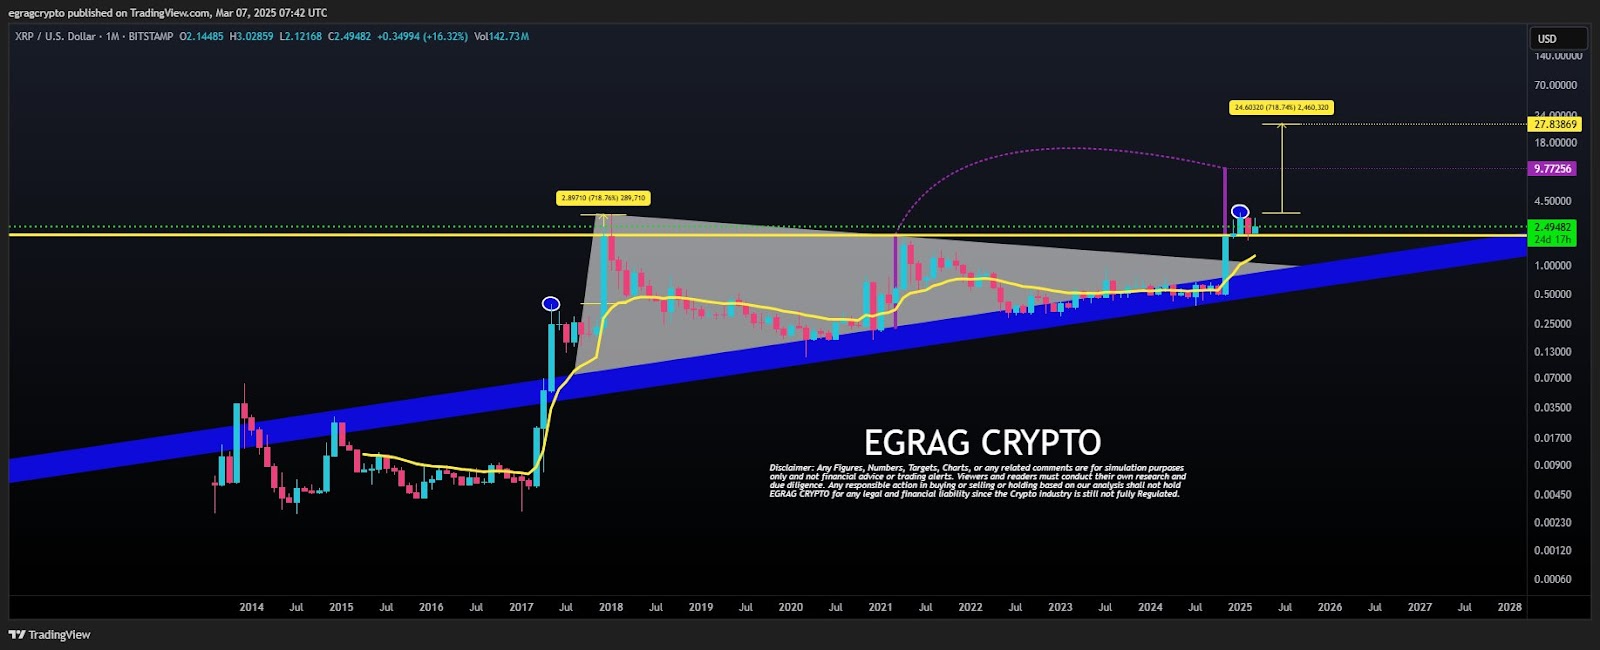
So, what’s the game plan according to EGRAG? They’re suggesting that if XRP manages to break free from its current holding pattern, we could see it climb to around $9.7. For those in the trading know, this level might be viewed as a crucial point of resistance. To manage risk and secure some gains along the way, the analyst recommends considering selling at different price points – maybe starting around $8, then $9, and again at $10 as it gets closer to that target.
Now, let’s talk about that bigger, bolder $27 target! This one comes from looking way back at the 2017-2018 bull run. Remember that crazy period? XRP went absolutely wild, surging by about 718% from its breakout point (around $0.35-$0.39). If we apply a similar 718% jump to a recent high point of roughly $3.4, well, that’s how the $27 projection comes into play.
Essentially, this approach uses XRP’s history as a guide, suggesting that if market conditions align in a similar way, we just might witness another massive, exponential climb.
Reality Check: Let’s Keep It Real
This whole analysis really leans into classic technical chart reading and looking at how prices have moved in the past. These are standard tools for many crypto traders out there – spotting patterns like triangle breakouts and using historical multipliers to get a feel for potential price movements.
But, and this is a big ‘but’, what happened before doesn’t guarantee what will happen next. Crypto predictions often miss the mark, and this is still just educated guesswork. Things outside of charts, like new regulations or shifts in how people feel about the market, can totally change the game.
So, while this kind of analysis based on technicals and history is interesting and valuable, it should never be seen as a guaranteed outcome.


