
XRP Crash Alert: 35% Price Drop Predicted

- It looks like traders are heavily leveraged around XRP’s price, with key leverage points at $1.828 (support) and $1.951 (resistance).
- Zooming in on the resistance level of $1.951, a significant $51.65 million in short positions have been placed, signaling a strong bet that XRP won’t break through this ceiling.
XRP, Ripple’s own cryptocurrency, seems set to keep heading downwards in the near future.
Right now, the overall feeling in the market is very negative, and those persistent tariff battles, with no resolution in sight, are adding to the downward pressure.
Current price momentum
As of writing, XRP was hovering around $1.85, even after experiencing a 6.50% jump in price over the last day.
However, during this same 24-hour period, trading activity for XRP actually decreased by 10%, which suggests fewer traders and investors are actively involved compared to recent days.
But don’t let that recent price bump fool you, XRP still looks bearish. Technical analysis from AMBCrypto indicates that XRP recently broke below a bearish head and shoulders pattern when looking at the daily chart.
Adding to the negative signals, XRP’s daily candle closed below the neckline of that pattern at $1.95. This is like a partial confirmation that prices are likely to fall further in the days ahead.
Source: TradingView
Can a 35% crash happen?
This neckline wasn’t just any line; it had been a significant horizontal support level for XRP, holding firm since November 2024.
In the past, whenever XRP’s price dipped to this level, it usually bounced back up or at least gained some upward momentum. But this time feels different – it’s actually broken through that support.
Considering the recent price movements and what’s happened historically, this break below support could pave the way for a significant 35% price drop, potentially sending XRP down to around $1.20 in the short term.
Adding to the bearish picture, with this recent dip, XRP has also fallen below and failed to hold above the 200 Exponential Moving Average (EMA) on the daily chart.
Falling and staying below the 200 EMA is a strong sign of bearish momentum, heavily suggesting that sellers are currently dominating the market.
In situations like these, traders and investors often see any slight price increase as a chance to jump into short positions, betting on further declines.
Bearish on-chain metrics
Reinforcing this negative view, it seems traders are indeed leaning bearish, heavily betting on further price drops, according to on-chain analytics from Coinglass.
Specifically, XRP’s Long/Short Ratio was at 0.98 at the time of writing. This number below 1 clearly signals a bearish leaning among traders, with more people in the market holding short positions compared to long ones.
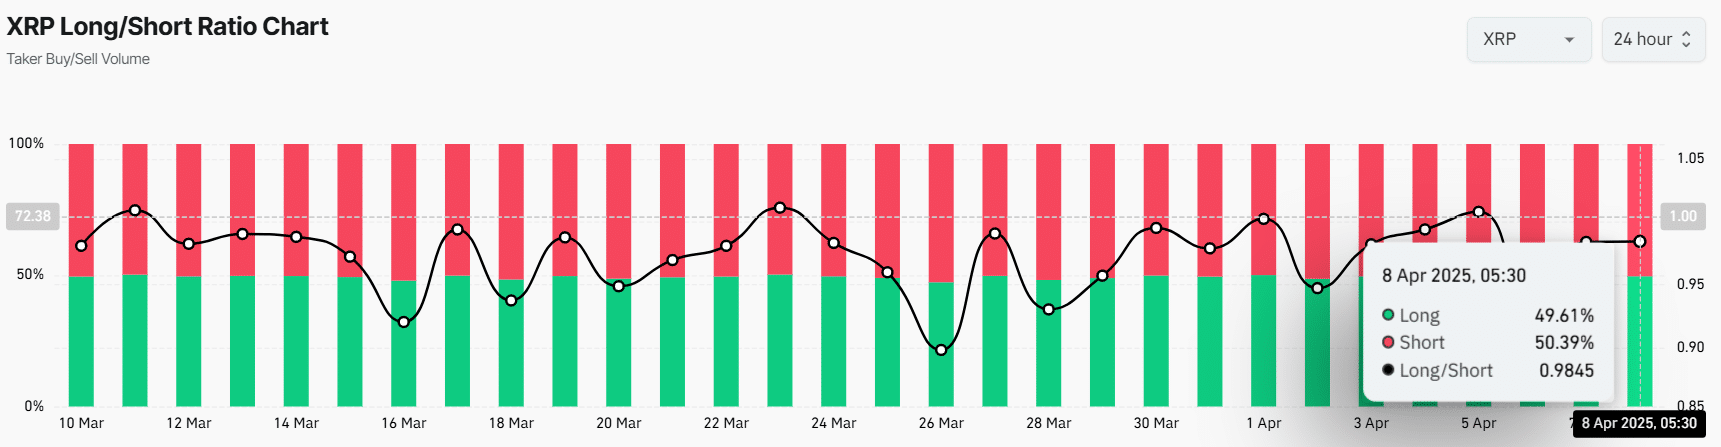
Source: Coinglass
$51.65 million worth of bearish bets
More data from Coinglass shows that traders are indeed over-leveraged at those key price points: $1.828 as support and $1.951 as resistance. Specifically, there are $22.50 million in leveraged long positions and a much larger $51.65 million in leveraged short positions stacked up.
These levels where liquidations could get triggered, along with the heavy short positioning, really highlight the current bearish mood in the market.
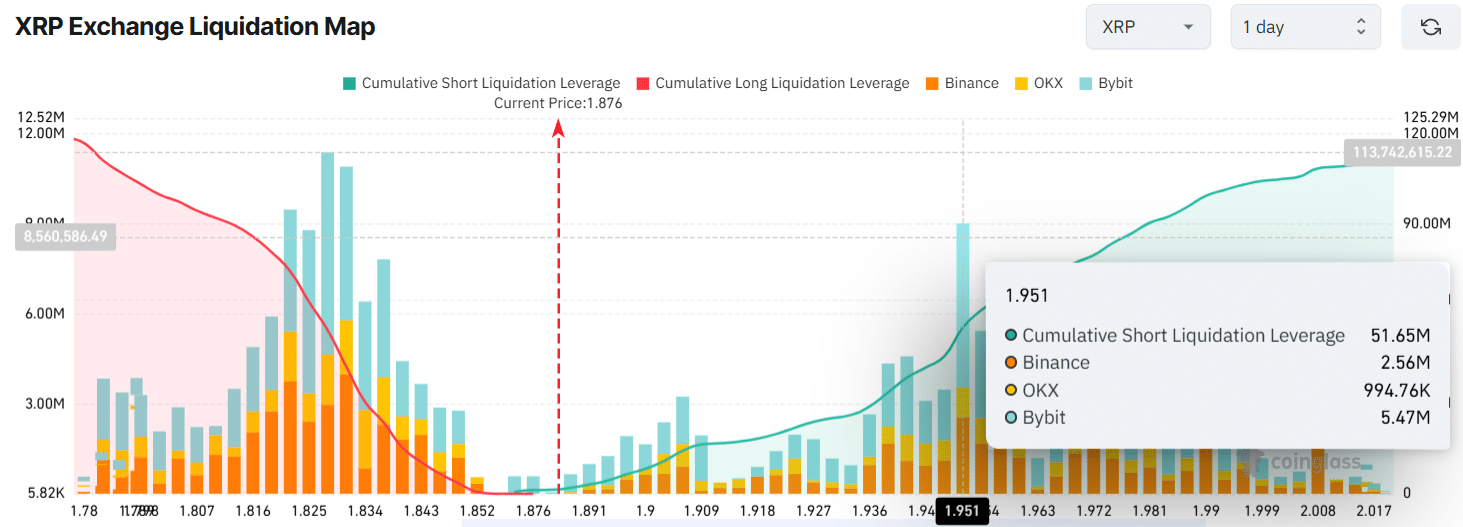
Source: Coinglass
Basically, if XRP’s price makes a significant move in either direction, these liquidation levels and heavily positioned trades are very likely to be activated.


