
XRP Surges: Triangle Breakout Past Key Resistance

- XRP is hinting at a potential price surge as it breaks free from a symmetrical triangle pattern.
- Keep an eye on the $1.50 and $3.80 resistance levels, as they could play a key role in shaping XRP’s upward journey.
- Technical indicators are starting to perk up, with the RSI currently at 46.50 and the MACD showing bullish signs.
Exciting news for XRP watchers! On the monthly chart, XRP has decisively broken through a symmetrical triangle pattern, often seen as a signal of significant price movement on the horizon. This breakout, a classic indicator of potentially increased market swings, has traders and analysts buzzing about where XRP might head next.
Technical Breakout Points to Possible Price Surge
That symmetrical triangle pattern we’re seeing on XRP’s monthly chart? It’s a real game-changer in terms of price structure. Think of it as a period of calm before a potential storm—this pattern forms as trendlines converge, indicating consolidation before a big move. XRP’s escape from this triangle suggests that the tug-of-war between buyers and sellers might be nearing its end, with the potential for some serious momentum to build.
According to insights from Ali Charts, XRP’s price has been bouncing around inside this triangle for quite some time, with ups and downs all the way until early 2024. The breakout above the triangle’s upper resistance line was pretty dramatic, sending the price soaring past $2.20. Interestingly, this breakout area is coinciding with a noticeable jump in market volatility.
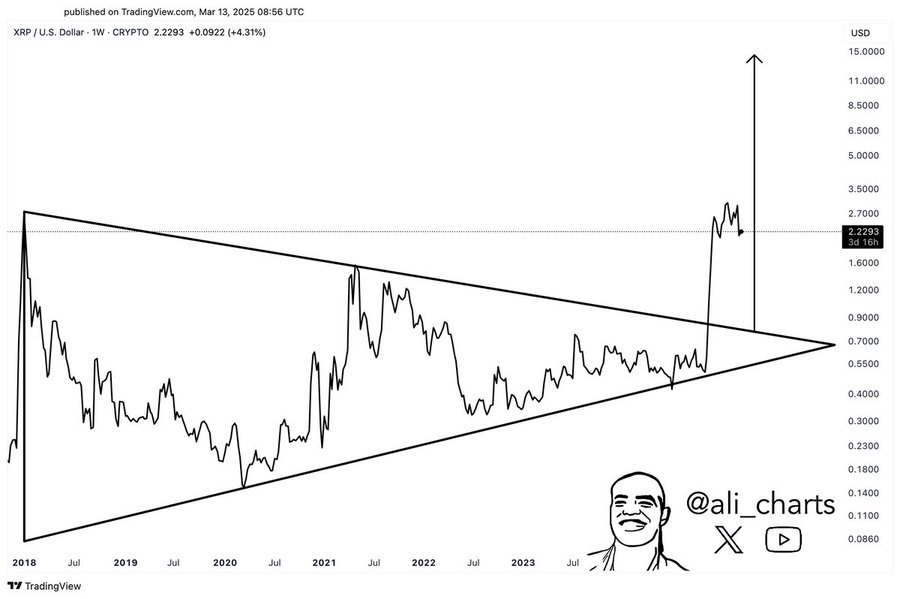
Historically, when we see a clean break from a symmetrical triangle like this, it often leads to a significant price move. Technical analysts are pointing towards a potential target of $15 for XRP. However, it’s not going to be a straight shot up – we should expect to see key resistance levels acting as hurdles along the way, influencing just how quickly and powerfully this upward trend develops.
Navigating Market Performance and Key Price Levels
Now that XRP has broken out, all eyes are on how it performs at various resistance points. The most immediate level to watch is around $1.50 – we’ve seen price reactions there before, so it’s a significant area. If XRP pushes beyond that, the next major resistance to anticipate is closer to $3.80, a level that has acted as a peak in past market activity.
Looking further ahead, if XRP maintains its climb, the $10 mark becomes an interesting zone. This aligns with historical Fibonacci extension levels, adding to its significance. And that $15 target we mentioned? That’s a projected move based on the height of the symmetrical triangle pattern itself, making it a key level on the radar if the bullish momentum stays strong.
Let’s peek at some technical indicators. The MACD is showing a slight bullish crossover – the MACD line is at 0.0118 and the signal line at -0.0651. This is often seen as a hint of potential upward momentum starting to build. However, the histogram is still looking a bit weak, suggesting that traders are still feeling somewhat uncertain.
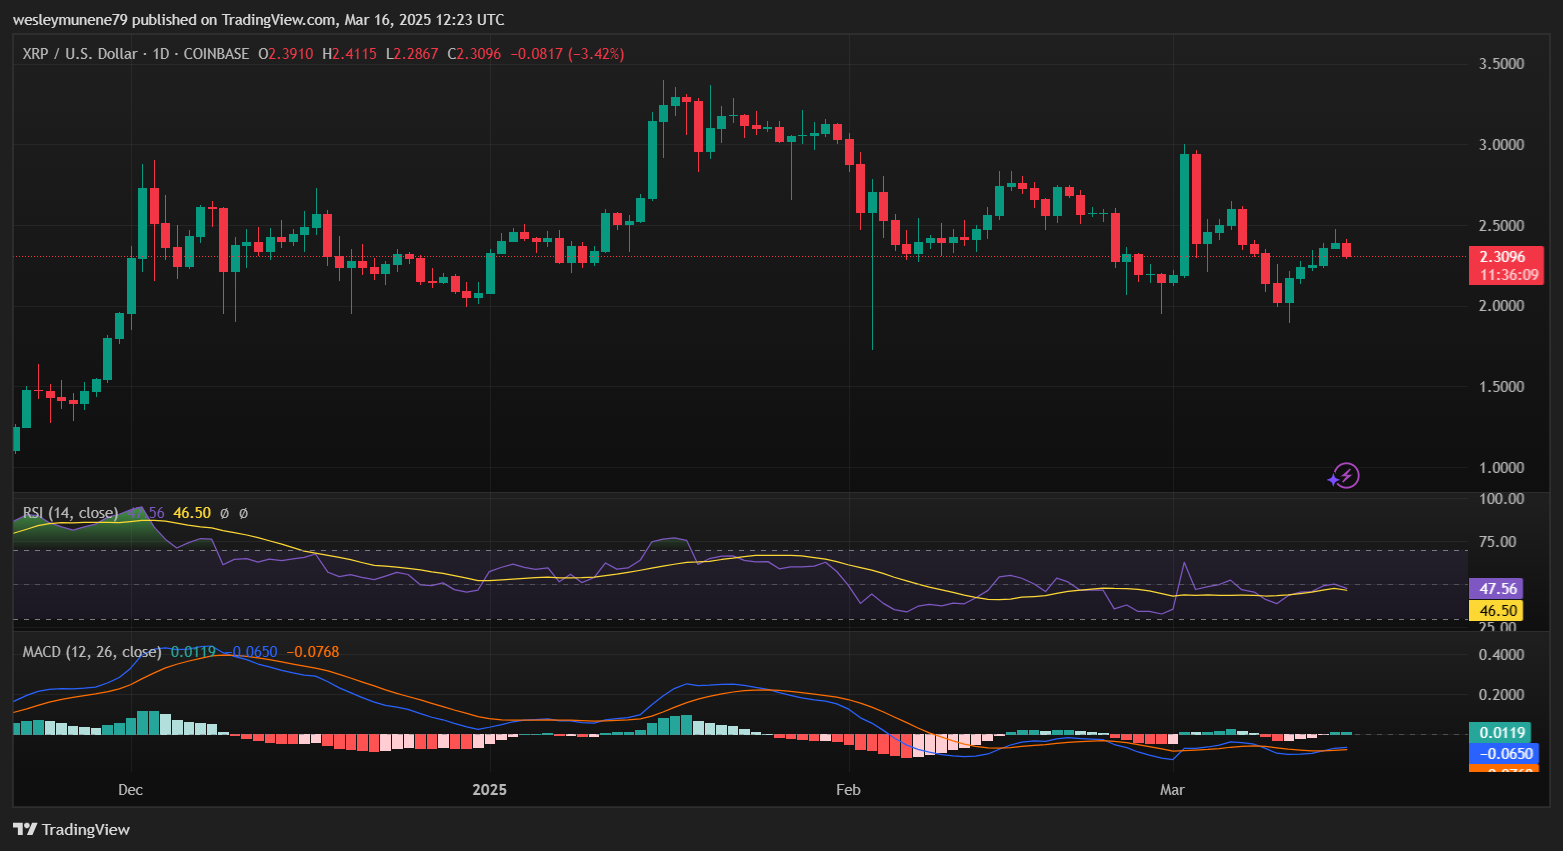
On the flip side, the RSI is currently at 46.50, still below that crucial 50 mid-line. This suggests that sellers might still have a bit of sway over price action for now. If the RSI can climb above 50, it could be a stronger sign that this bullish trend is gaining real strength.
Looking at potential price movements in the short term, we might see some back-and-forth around $2.30 as a consolidation point. If XRP can break upwards past $2.50, we could see further upward momentum kick in. However, if it falls below, watch out for a potential test of lower support levels around $2.00.


