
Volatility Plunge: Bitcoin’s Volatility – What to Expect?

- Bitcoin’s volatility is calming down, hitting a 1-week low of 23.42%
- Historically, when volatility gets this quiet, big moves often follow
Bitcoin is making headlines today because things have gotten unusually quiet. Its one-week realized volatility has dipped to just 23.42%, bringing it close to levels we haven’t seen in a while. Looking back over the last four years, we’ve only seen volatility this low a few times, most recently in October 2024 [22.88%] and November 2023 [21.35%].
This kind of low volatility isn’t just a number; it’s often been a sign that the market is gearing up for something significant. That’s why keeping an eye on this metric right now is really important.
Bitcoin’s volatility is squeezing – Could it be the calm before a major storm?
If you take a look at the realized volatility chart, you’ll see a clear trend: Bitcoin’s volatility has been on a downward path since late 2024. As we’re talking right now, it’s hovering around the 23% mark.
Historically speaking, when volatility shrinks like this, it’s often like coiling a spring. We tend to see some pretty big price swings afterward, often setting the stage for breakouts.
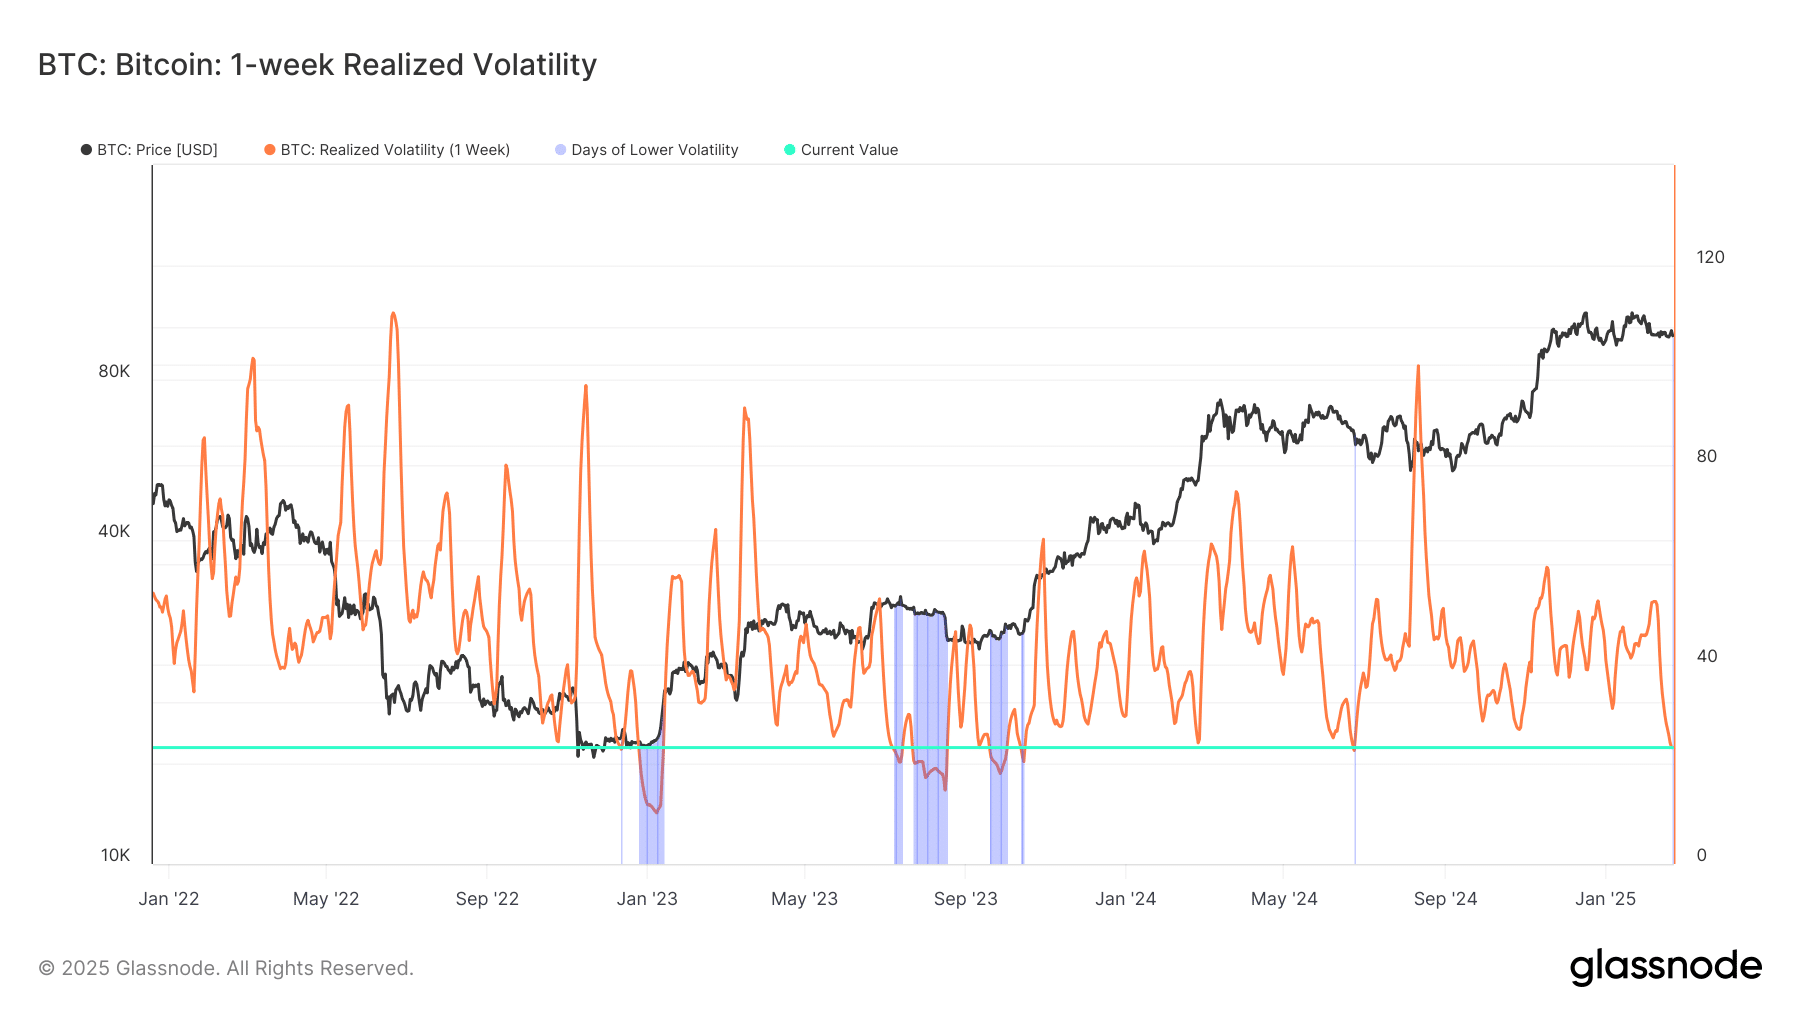
Source: Glassnode
Throughout history, these periods of quiet volatility often build up pressure in the market, eventually leading to some pretty powerful moves in either direction. When Bitcoin’s been trading around important technical levels during these volatility squeezes, we’ve often seen bullish surges follow.
Looking closer at the volatility chart really backs this up. It shows a clear pattern of upward price movement whenever volatility breaks through these key low levels.
Where is Bitcoin’s volatility price heading and what’s the market mood?
Right now, Bitcoin is trading around $96,450 at the time of writing, showing a little bit of positive movement from where it was before.
Checking out the 12-hour price chart, it looks like Bitcoin is having a bit of a tussle trying to stay above its 50-day moving average [$98,186]. However, it’s still holding comfortably above the 200-day moving average [$97,764].
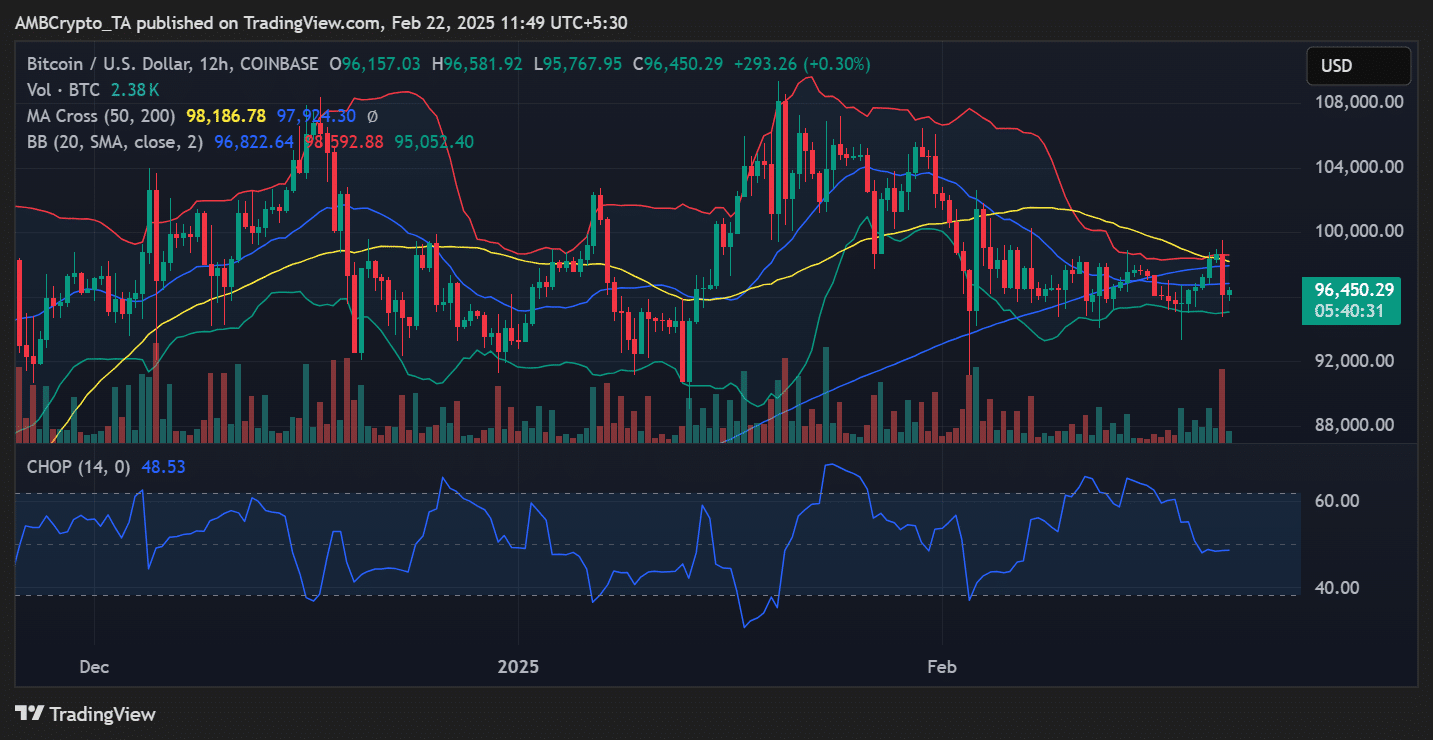
Source: TradingView
Adding to the picture, the Bollinger Bands are also getting tighter, which further hints that a price move could be brewing. The Choppiness Index is currently at 48.53, suggesting that while the market isn’t in a strong trend just yet, it might be wrapping up its consolidation phase.
What’s next for Bitcoin?
With volatility getting so low, it really feels like the market is winding up for a significant move. If Bitcoin can hold its ground around the $96,000 – $97,000 level, breaking above $98,500 could kickstart some serious upward momentum.
On the flip side, if Bitcoin can’t maintain these levels, we might see it test support closer to $94,000 before we see any real recovery.
For investors and traders, the key is to watch for signs of volatility picking back up – things like Bollinger Bands widening out and trading volume increasing. These signals can help give us a heads-up on the direction of the next big price swing.


